U.S. Fast-Charging Power Mix Shifted in 2025 — Here's Why It Matters
In 2025, public fast charging in the U.S. didn’t just grow — the power mix shifted.
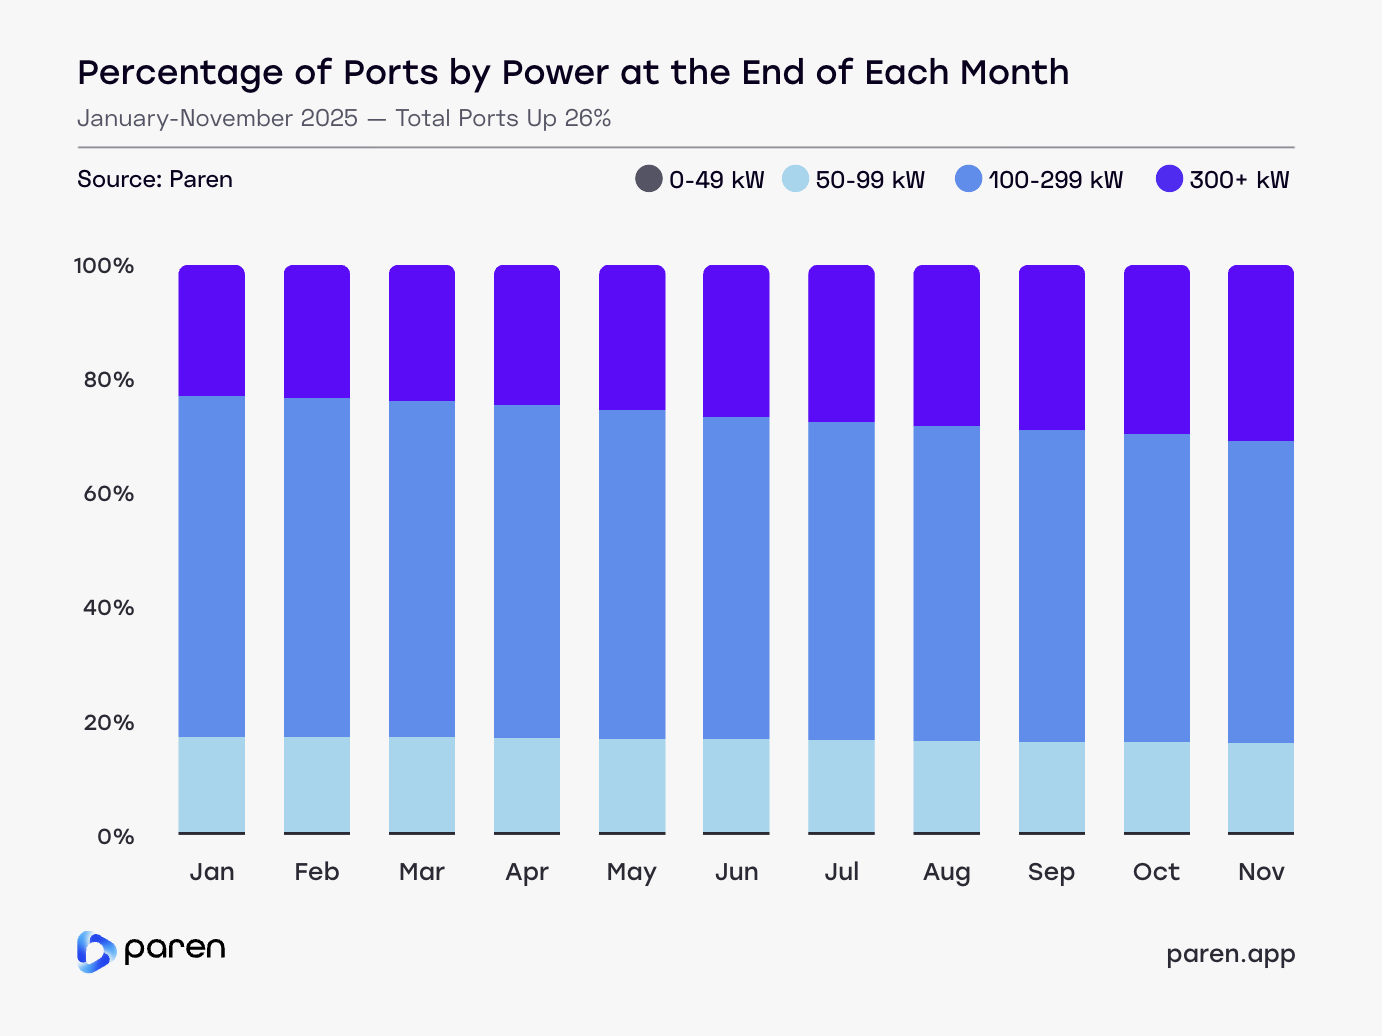
To understand how that shift played out over the year, we looked at how the share of ports online changed across four power tiers: 0–49 kW, 50–99 kW, 100–299 kW, and 300+ kW.
Methodology
This analysis is based on Paren’s U.S. public charging dataset and focuses on ports online from January through November 2025.
Takeaway 1: Ultra-fast charging grew quickly in 2025 — but only in certain places, by certain networks
Ports rated 300+ kW grew by roughly 70% from January to November 2025, increasing from 12,308 to 20,977 ports — an addition of 8,669 ultra-fast ports in just 11 months. This growth materially changed the overall power mix of chargers online.
Most of the ultra-fast expansion came from Tesla, with additional contributions from a smaller group of non-Tesla networks such as EVgo, Electrify America, IONNA, and highway-oriented operators including Pilot Flying J and Rivian Adventure Network. These networks share a common focus: corridor-scale, long-distance charging.
Deploying 300+ kW infrastructure at scale is a very different proposition than deploying lower-power fast charging. It typically requires:
- larger grid upgrades,
- higher capital investment per site, and
- confidence that locations will see sustained, high-throughput demand.
As more EVs enter the market with the ability to accept 250 kW+ charging and improved charging curves, these corridor sites play an outsized role in driver confidence and trip reliability. The data suggests that ultra-fast growth in 2025 reflects targeted deployment where speed meaningfully improves the charging experience, not a blanket shift across all locations.
Takeaway 2: 100–299 kW is still doing most of the work — and it’s largely a non-Tesla buildout
Even with ultra-fast charging scaling rapidly, 100–299 kW remains the largest power tier throughout 2025. This range continues to anchor the majority of public fast-charging ports online.
In 2025, growth in the 100–299 kW range is largely non-Tesla, spread across many charging networks and site types. By comparison, most of the growth in the 300+ kW tier is coming from a much smaller set of networks.
This split reflects different operating realities:
- Tesla, which controls both the vehicle platform and the charging network, is increasingly able to justify higher-power investment as its fleet and network mature.
- Non-Tesla operators are balancing broader vehicle compatibility, site diversity, and utilization risk — making 100–299 kW the most flexible and scalable fast-charging option.
Rather than being displaced by ultra-fast charging, the 100–299 kW tier continues to function as the backbone of public fast charging, especially in a NEVI-era market where this range effectively sets the baseline for fast-charging performance.
Takeaway 3: Mid-power fast charging keeps showing up where drivers stay longer
One of the quieter but more telling signals in the 2025 data is the continued growth of 50–99 kW fast charging.
From January to November, this tier grew by roughly 17%, adding about 1,700 ports, while maintaining a relatively steady share of the overall network. That stability suggests intentional deployment — not legacy infrastructure lingering in place.
This growth is led by ChargePoint and closely tied to long-dwell locations such as restaurants, shopping centers, and auto dealerships. In these settings, ultra-fast charging often offers limited incremental value relative to its cost.
For many sites:
- dwell time is long enough that mid-power charging is sufficient,
- electrical upgrades for higher power can be expensive or constrained, and
- availability and convenience matter more than maximum speed.
The continued rollout of 50–99 kW ports shows that mid-power fast charging remains a deliberate economic choice, filling gaps where higher-power infrastructure doesn’t pencil.
What this means heading into 2026
Taken together, 2025 doesn’t point to a market converging on a single power level. It points to a layered charging network taking shape:
- 300+ kW is expanding rapidly where corridor travel, reliability, and speed justify the investment.
- 100–299 kW continues to anchor fast-charging deployment across diverse networks and locations.
- 50–99 kW remains a viable solution for long-dwell and cost-constrained sites.
Understanding where charging infrastructure is headed now requires more than tracking total port counts. It requires understanding who is building which power tiers, where those deployments are happening, and why those choices make sense.
We’ll continue to explore those questions in upcoming posts — and in our full-year 2025 State of the Industry Report, coming January 2026.