What Happens to New EV Fast-Charging Stations After 90 Days?
When a new fast charging station opens, it often carries high expectations. But Paren’s latest analysis of 892 fast charging stations that came online in 2025 reveals a clear truth: the first 90 days are incredibly tough.
Our methodology:
- US fast charging stations which opened in 2025 and that have least been running for 90 days
- We average utilization rate on the last week leading to their 90th day
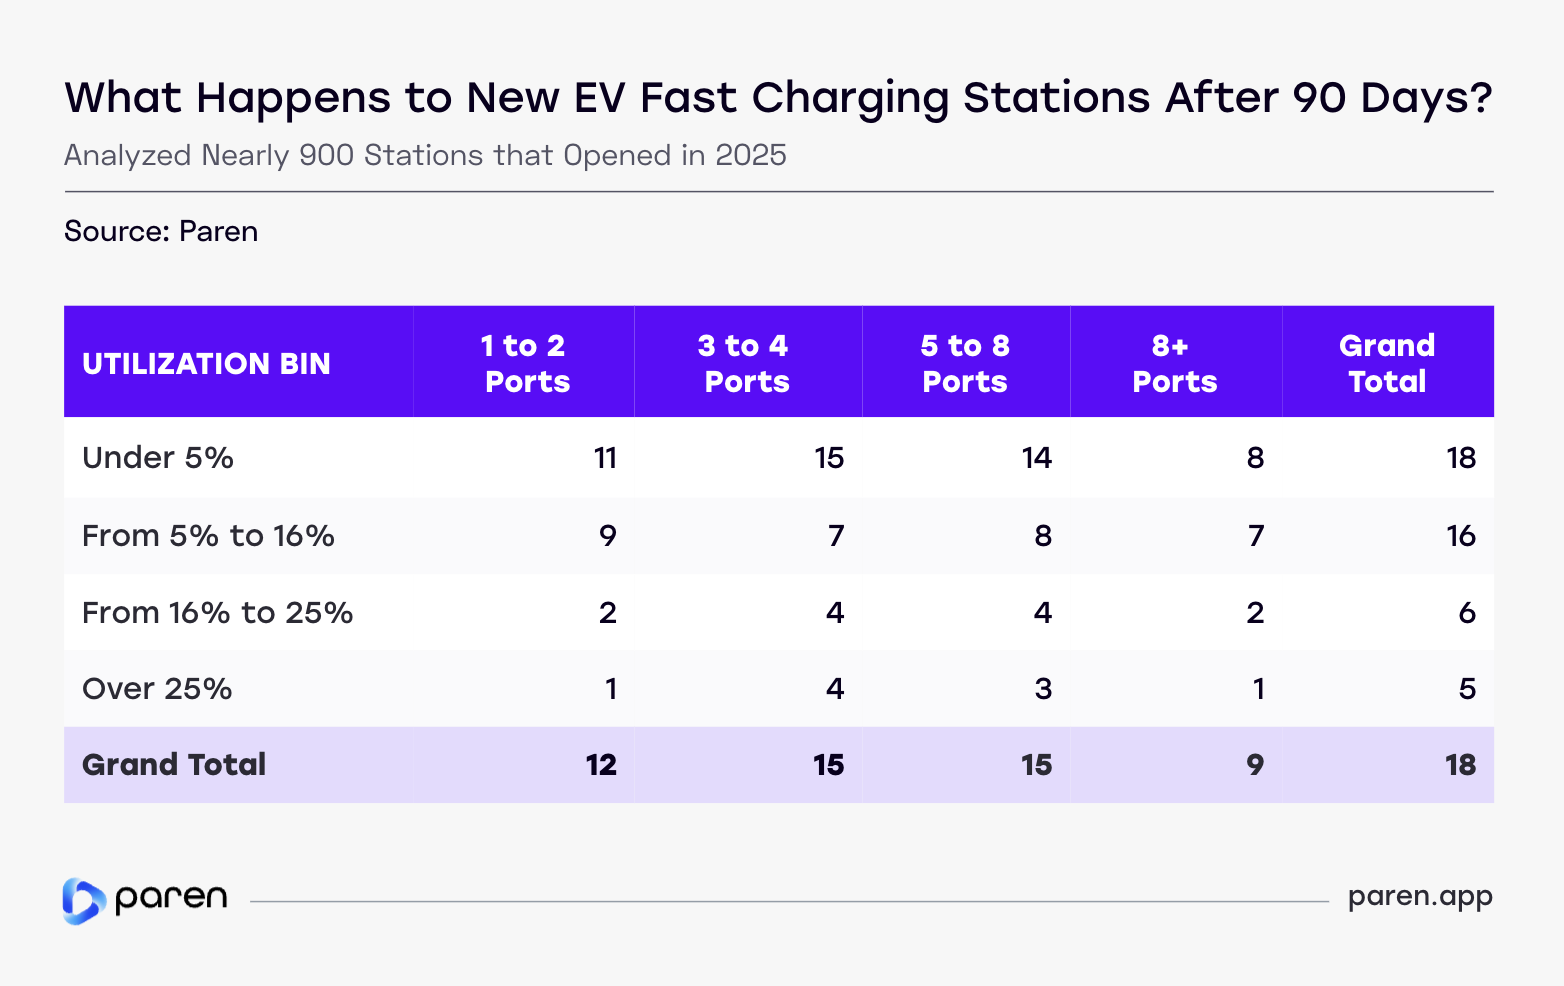
- We categorized stations per port size: 1-2, 3-4, 5-8 and 8+ ports
- We grouped utilization by bins: under 5%, from 5% to 16%, 16% to 25% and over 25%
- Paren datasets used: US Nationwide metadata, Utilization
Takeaway #1 - The first 90 days are challenging, no matter the operator
63% of stations do not achieve a 5% average utilization rate on the last week leading to their 90 days after opening.
Takeaway #2 - A cold start is the norm. Even more so for small stations.
89% of stations do not meet the average national utilization rate of 16% after 90 days. Stations with a small port count were more prone to a slower adoption.

79% of stations not hitting 5% had four ports or less. 54% of stations not meeting the national average were also stations with four ports or less.
Takeaway #3 - High performers in the first 90 days are stations with 5 or more ports
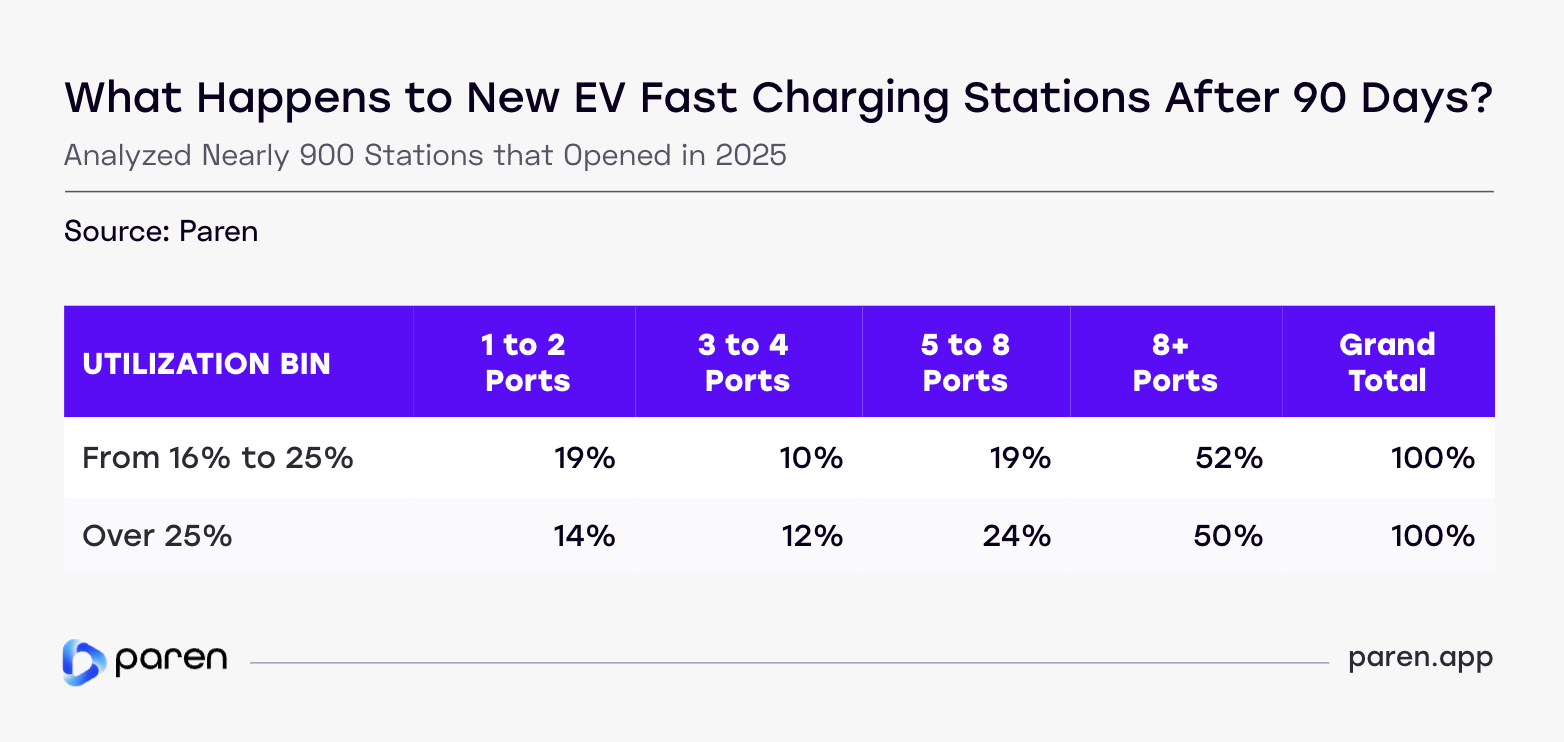
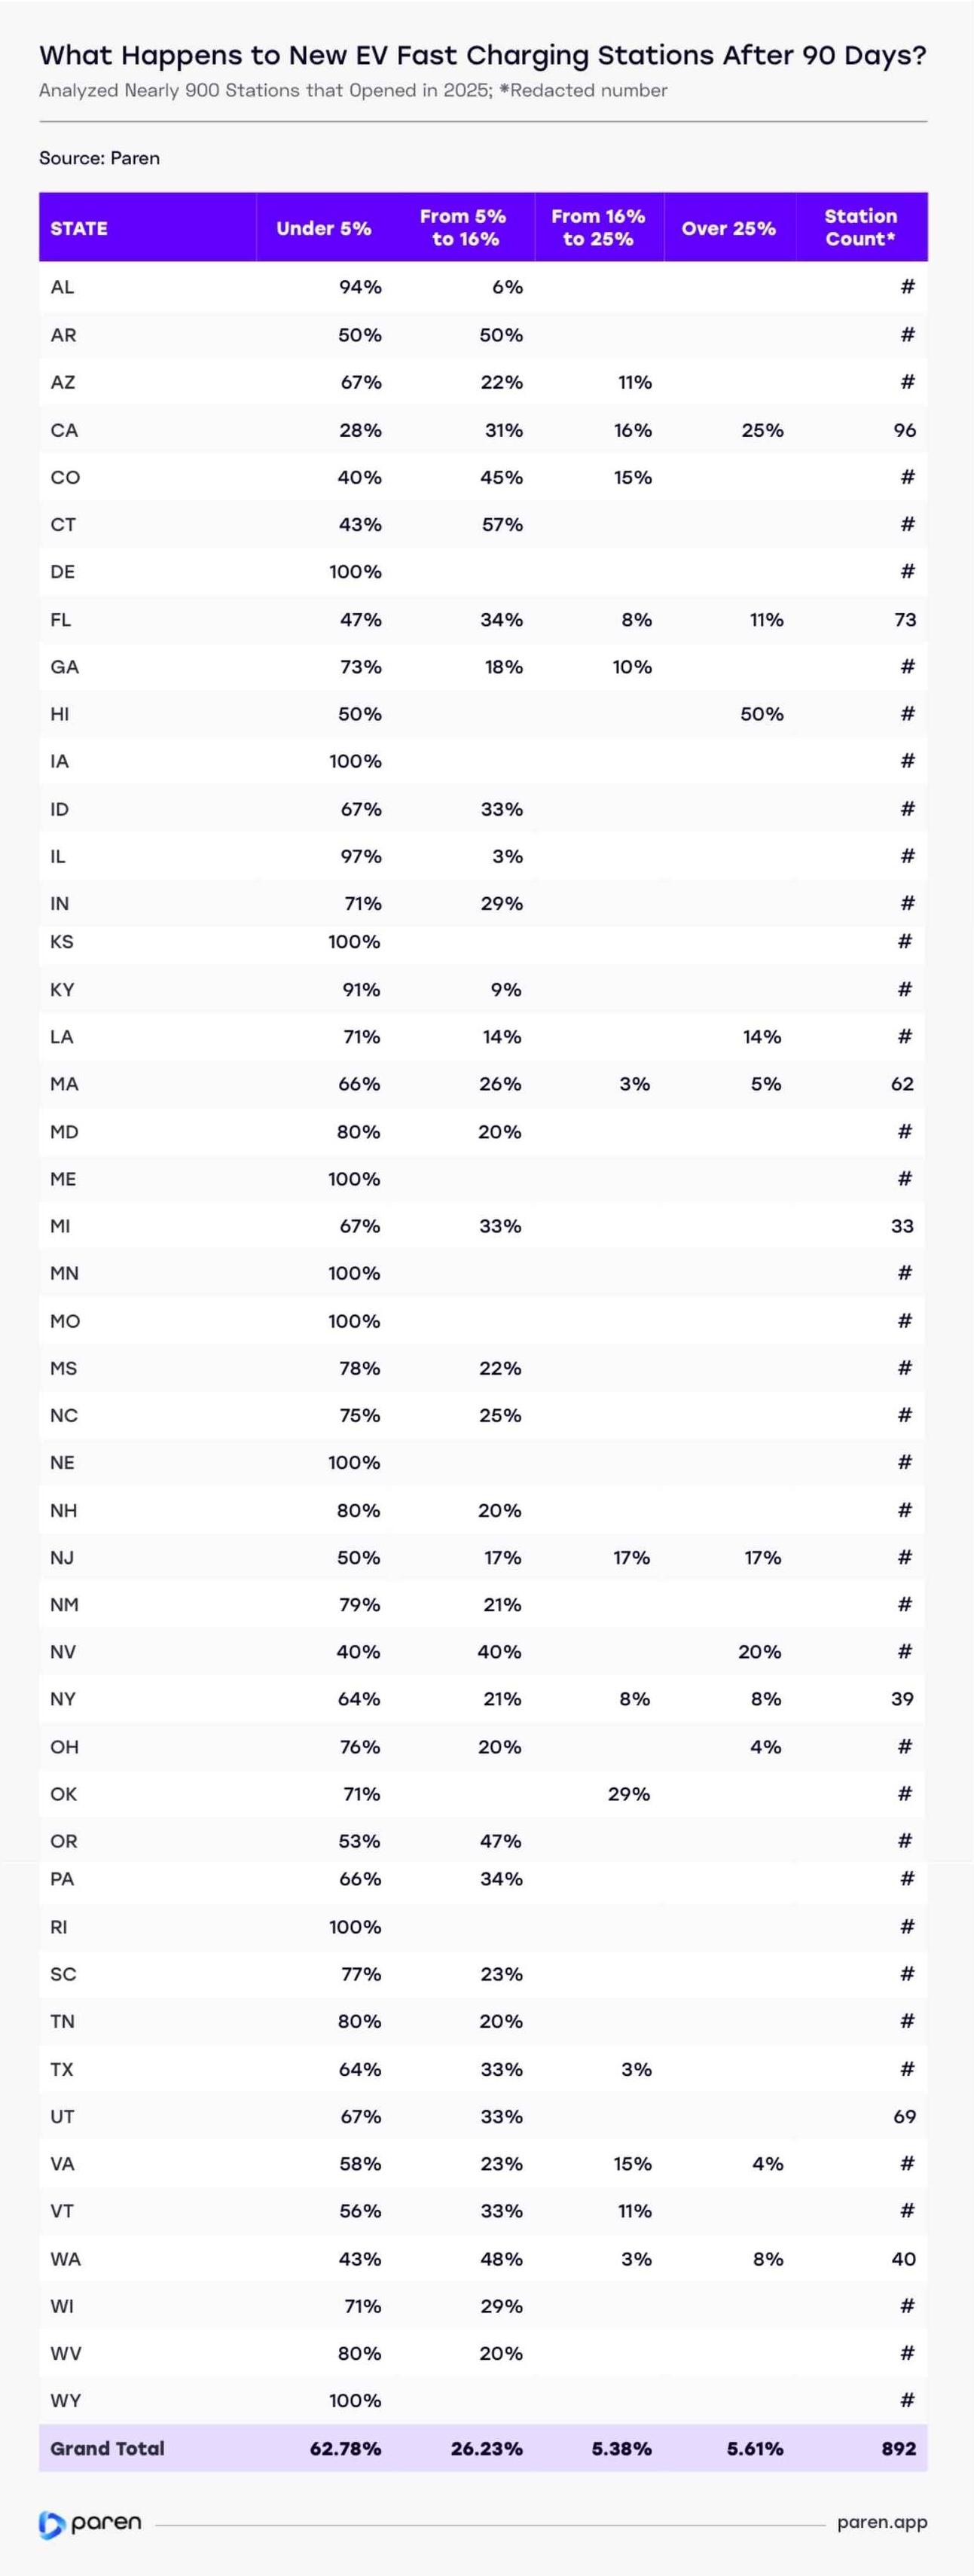
71% of the stations outperforming the national average in their first 90 days have at least 5 ports. California continues to prove its EV leadership: 41% of its 96 new stations exceeded the 16% utilization benchmark.
💡 Want to dive deeper? Contact us or book a meeting with our team.