Canadian EV Fast Charging — Q2 2026
The State of the EV Charging Industry Q2 2026 Canada report delivers detailed analysis of Canada's EV fast-charging infrastructure. Track deployment growth, utilization patterns by province, reliability performance, and pricing models across networks. Key insights on DCFC station expansion, high-power adoption, and charging infrastructure development across Canadian provinces.

About This Report
The State of the Industry report is Paren's quarterly deep-dive into Canadian public fast charging - tracking infrastructure growth, network reliability, operator market share, provincial deployment and pricing trends. We publish it free of charge to give the industry a shared, standardized view of the data. It is independent work: not sponsored, and not affiliated with any charge point operator or automaker.
Data reflects all publicly accessible DCFC ports in Canada, updated daily - Paren monitors more than 90% of Canada's DCFC infrastructure in real time. In this edition, we've also given the floor to a leading industry expert to share their perspective on where the market is heading. We hope you enjoy the report.
Industry Perspective: Guest View
Playing the Long Game
Canada's fast-charging network kept expanding through a sharp EV sales downturn — and a more independent auto-policy path will shape what comes next.
EV fast-charging infrastructure comes with a significant lag — a site that opens today was not based on a decision made today, it has actually been in the works since 2024. This is what we're seeing in the Canadian charging industry in 2Q 2026: EV sales dropped by 35% in 2025 as incentive programs were cut, but the charging industry kept building.
Now, we're starting to see the impact. EV fast-charging ports were up by 30% year-over-year, but utilization dropped — simply put, charging ports grew faster than charging demand. Does this mean the Canadian charging industry has an overcapacity problem? Not yet. With EV sales picking back up in 2026, we are likely to see stronger utilization before long. But it does drive home a key point.
That relates directly back to EV policy. Historically, auto policy in Canada has closely tracked the United States. But this is rapidly changing. The federal auto strategy presented in February — written in response to trade tensions with the United States — is setting a more independent path. This includes key differences on greenhouse gas emissions standards, EV purchase incentives, and EV imports from China. And it promised a national charging infrastructure strategy in the fall, which should set the stage for the next wave of charging investments.
In the charging industry, policy and public funding can set the tone for years — everything from geography, to charging speed requirements, to payment options, to amenities. It can also shape the structure of the industry itself. For instance, Canada's charging industry has a much stronger presence of publicly-owned utility networks.
Beyond policy, new entrants can also bring unexpected changes: BYD, for instance, has brought its flash-charging technology to Europe, and may be bringing it to Canada, promising speeds of up to 1,500 KW.
How will all of this impact Canada's EV charging industry? It won't for a while, because of the long lag — it will take years to see the full impact.
More chargers, faster chargers, better reliability, and cheap pricing — this is the good news for EV drivers across Canada.


Section 1: Charging Infrastructure Expansion
Q2 Buildout Stays on a Higher-Capacity Path
DEPLOYMENT CONTINUES AT A HIGHER-CAPACITY CADENCE.
Canada brought online 390 new DCFC ports across 99 new stations in Q2 2026 (April–June) — well above the entire Q2 2025 total of 300 ports and 81 stations, a 30% year-on-year step up, and roughly 3.9 ports per new station.
THE BUILD IS ROTATING BACK TOWARD THE ESTABLISHED NETWORKS.
Tesla led Q2 with 98 new ports, followed by a cluster of legacy operators — Circuit Électrique (60), ChargePoint (44), On the Run (43) and Flo (43) — with Couche-Tard (32) stepping up. Incremental growth has swung back toward the incumbents — though utility- and fuel-retail deployers built in lumpy bursts, so some of this is timing rather than retreat.
CANADA IS FOLLOWING THE U.S. DENSIFICATION PATH A STEP BEHIND.
Canada's port base grew about 7.6% in Q1 2026 — a quicker percentage clip than the U.S., though its absolute additions run roughly a tenth of the U.S.'s. Unlike the U.S., where deployment resets in Q1 after a Q4 peak, Canada kept expanding into Q1 2026 (668 ports, its strongest quarter on record), showing far less buildout seasonality. Q2's 390 ports comfortably clears the year-ago Q2 2025 total of 300.

Non-Tesla Site Size Climbs; Tesla's Q2 Ratio Swings on a Thin Sample
NON-TESLA OPERATORS KEEP BUILDING BIGGER — BUT REMAIN A STEP BEHIND THE U.S.
New non-Tesla sites averaged about 3.2 ports each in Q2 2026, climbing from the 3.9 Q1 high but still well above the 2.4 of a year earlier. Canada's new-site size still trails the U.S., where non-Tesla sites run closer to 4.5 ports each — placing Canada earlier in the same densification cycle.
TESLA'S PER-SITE RATIO IS VOLATILE ON A THIN Q2 SAMPLE.
Tesla's 16.3 ports-per-new-site reflects just six new Tesla stations opened in Q2, down from eight in Q1 — too small to read as a trend, and it does not reverse Tesla's multi-quarter moderation in new-site size (16.0 to 14.9 to 13.1 to 12.0 across the prior four quarters). It reinforces that Tesla is opening fewer stations but packing more ports into each — densifying rather than broadening, even as its share of new builds has fallen below its installed-base weight (deployment table on page 8).
CONVERGENCE MIRRORS THE U.S. PATTERN.
Across completed quarters the gap between Tesla and non-Tesla new-site size has compressed steadily as non-Tesla operators scaled up and Tesla normalized — the same two-sided convergence underway in the U.S. Canada is tracking that structural shift a step behind; the Q2 widening here is a small-sample artifact, not a trend break.

Tesla Still Leads, but Keeps Ceding Share to Established Networks
TESLA REMAINS THE ANCHOR, BUT IS A SHRINKING SLICE OF GROWTH.
Tesla added 98 new ports in Q2 — the single largest deployer at 25.1% of the quarter, and around 33.0% of the all-time base. But its share of new builds again ran below its installed footprint (25.1% versus 33.0%), and well off the roughly 37–40% it commanded in the first half of 2025. Tesla is opening fewer, larger sites (as shown on page 7), steadily ceding share of incremental port growth even as it holds the top spot.
THE ESTABLISHED NETWORKS ARE BACK IN FRONT OF INCREMENTAL GROWTH.
Circuit Électrique (60 ports, 15.4%), ChargePoint (44, 11.3%), On the Run (43, 11.0%) and Flo (43, 11.0%) cluster right behind Tesla. After Q1's burst from a more mixed group of new and established entrants, Q2 deployment rotated back toward the incumbents that anchor the installed base.
A FEW SCALING PLAYERS ARE PUNCHING ABOVE THEIR FOOTPRINT.
On the Run (11.0% of Q2 versus 2.3% all-time), Couche Tard (8.2% versus 2.6%), ChargePoint (11.3% versus 6.9%) and ChargeLab (3.6% versus 1.2%) each deployed well above their installed weight. BC Hydro, by contrast, built below its footprint this quarter (2.6% versus 7.7%), consistent with the lumpy cadence typical of utility-led deployment rather than a structural pullback.
GROWTH RE-CONCENTRATED THIS QUARTER.
The long-tail "Other Networks" accounted for just 7.7% of Q2 new ports, down from 14.7% in Q1, as Tesla and the top operators captured more of the build — a swing back toward concentration after Q1.

Q2 2026's 99 New Stations Cluster in Québec, Ontario and British Columbia
CONCENTRATED, NOT NATIONWIDE.
Where the U.S. buildout spread across nearly every state, Canada's Q2 openings clustered hard: Québec led by a wide margin — 44 new stations — followed by Ontario (21) and British Columbia (18), with Alberta and the Atlantic provinces each adding a handful. The footprint mirrors where the installed base is deepest: the Windsor–Québec corridor and the B.C. south coast.
SPLIT EVENLY URBAN AND RURAL — UNLIKE THE U.S.
The build divided almost in half — 50 urban stations to 49 rural — where the U.S. skewed roughly four in five urban. The rural half follows the highways into smaller markets: Vancouver Island, the Gaspé, the Saguenay and Atlantic Canada. That reflects the reach of Canada's intercity corridors as much as metro density, and lines up with the flat metro port bases on the utilization pages.
THE MAP'S WHITE SPACE IS THE STORY.
Almost nothing new landed across the Prairies or the territories — Manitoba added a single station, and Saskatchewan and the North added none. Alberta (7) and Atlantic Canada (Nova Scotia 4, Newfoundland & Labrador 4) saw only a handful. Q2's build reinforced the corridors that already have the deepest coverage rather than extending the network into thin regions, so Canada's geographic charging gaps persist into the second half of the year.

Mid-Power Stays the Canadian Default – While the U.S. Builds for Peak Power
MID-POWER DOMINATES NEW DEPLOYMENTS.
The 150–249 kW band held at 61% of Q2 Non-Tesla new ports, level with Q1 2026 — extending its run as the default tier for Canadian new builds. Canada keeps sizing new non-Tesla capacity to this mid-power band rather than chasing the highest peak speeds.
ULTRA-FAST EASED THIS QUARTER, ON A THIN SAMPLE.
The 250+ kW share of Non-Tesla new ports fell to 14% (from 20% in Q1) — fewer ultra-fast non-Tesla sites landed in Q2. With Tesla's overwhelmingly 250+ builds incl.uded, 250+ kW is about 33% of all new ports; the non-Tesla dip is a genuine Q2 shift, though it rests on a small count.
LOWER-POWER TICKED BACK UP.
Sub-150 kW rose to 25% of Non-Tesla new ports (from 19% in Q1), consistent with targeted urban and lower-cost siting rather than a reversal of the higher-power trend.
CANADA AND THE U.S. ARE BUILDING FOR DIFFERENT GOALS.
Canada's new builds remain firmly mid-power (150–249 kW dominant), whereas the U.S. skews to peak power — roughly 56% of new Non-Tesla U.S. ports (and around 69% across all operators) were 250+ kW in Q2 2026, versus 14% (non-Tesla) and 33% (all operators) in Canada. Canadian operators are optimizing for site economics and grid fit; the U.S. is pushing the high-power frontier harder.

Per-Port Demand Softens as the Network Outgrows It; Volume Keeps Climbing
PER-PORT INTENSITY HAS EASED AS SUPPLY OUTPACED DEMAND.
Sessions per port ran highest in summer 2025, then declined through the fall and winter to a February low before recovering to around 131 in May and 133 in June. The multi-quarter drift down is structural, not just seasonal: the session-observed port base grew about 42% over the window while total sessions rose far less, so demand per tracked port thinned even as the network expanded — the same dynamic behind the easing utilization on page 13.
TOTAL VOLUME KEEPS CLIMBING WITH THE NETWORK.
Monthly sessions rose from roughly 0.8 million in mid-2025 toward the roughly 1.0–1.1 million range, tracking the larger installed base. December was the volume high (around 1.14 million); February the seasonal low (around 0.92 million).
THE SPRING RECOVERY LEVELED OFF IN JUNE.
April and May 2026 ran at roughly 0.93 million and 1.02 million sessions respectively, with sessions per port near 120 and 131. That marked a recovery from the February trough but remained below summer-2025 per-port levels. June settled at about 1.05 million sessions across 7,884 ports, with sessions per port near 133. Its port base finished above May's, so per-port intensity held roughly flat rather than climbing further.

Section 2: Utilization & Reliability
Utilization Steps Down as Port Growth Outpaces Demand
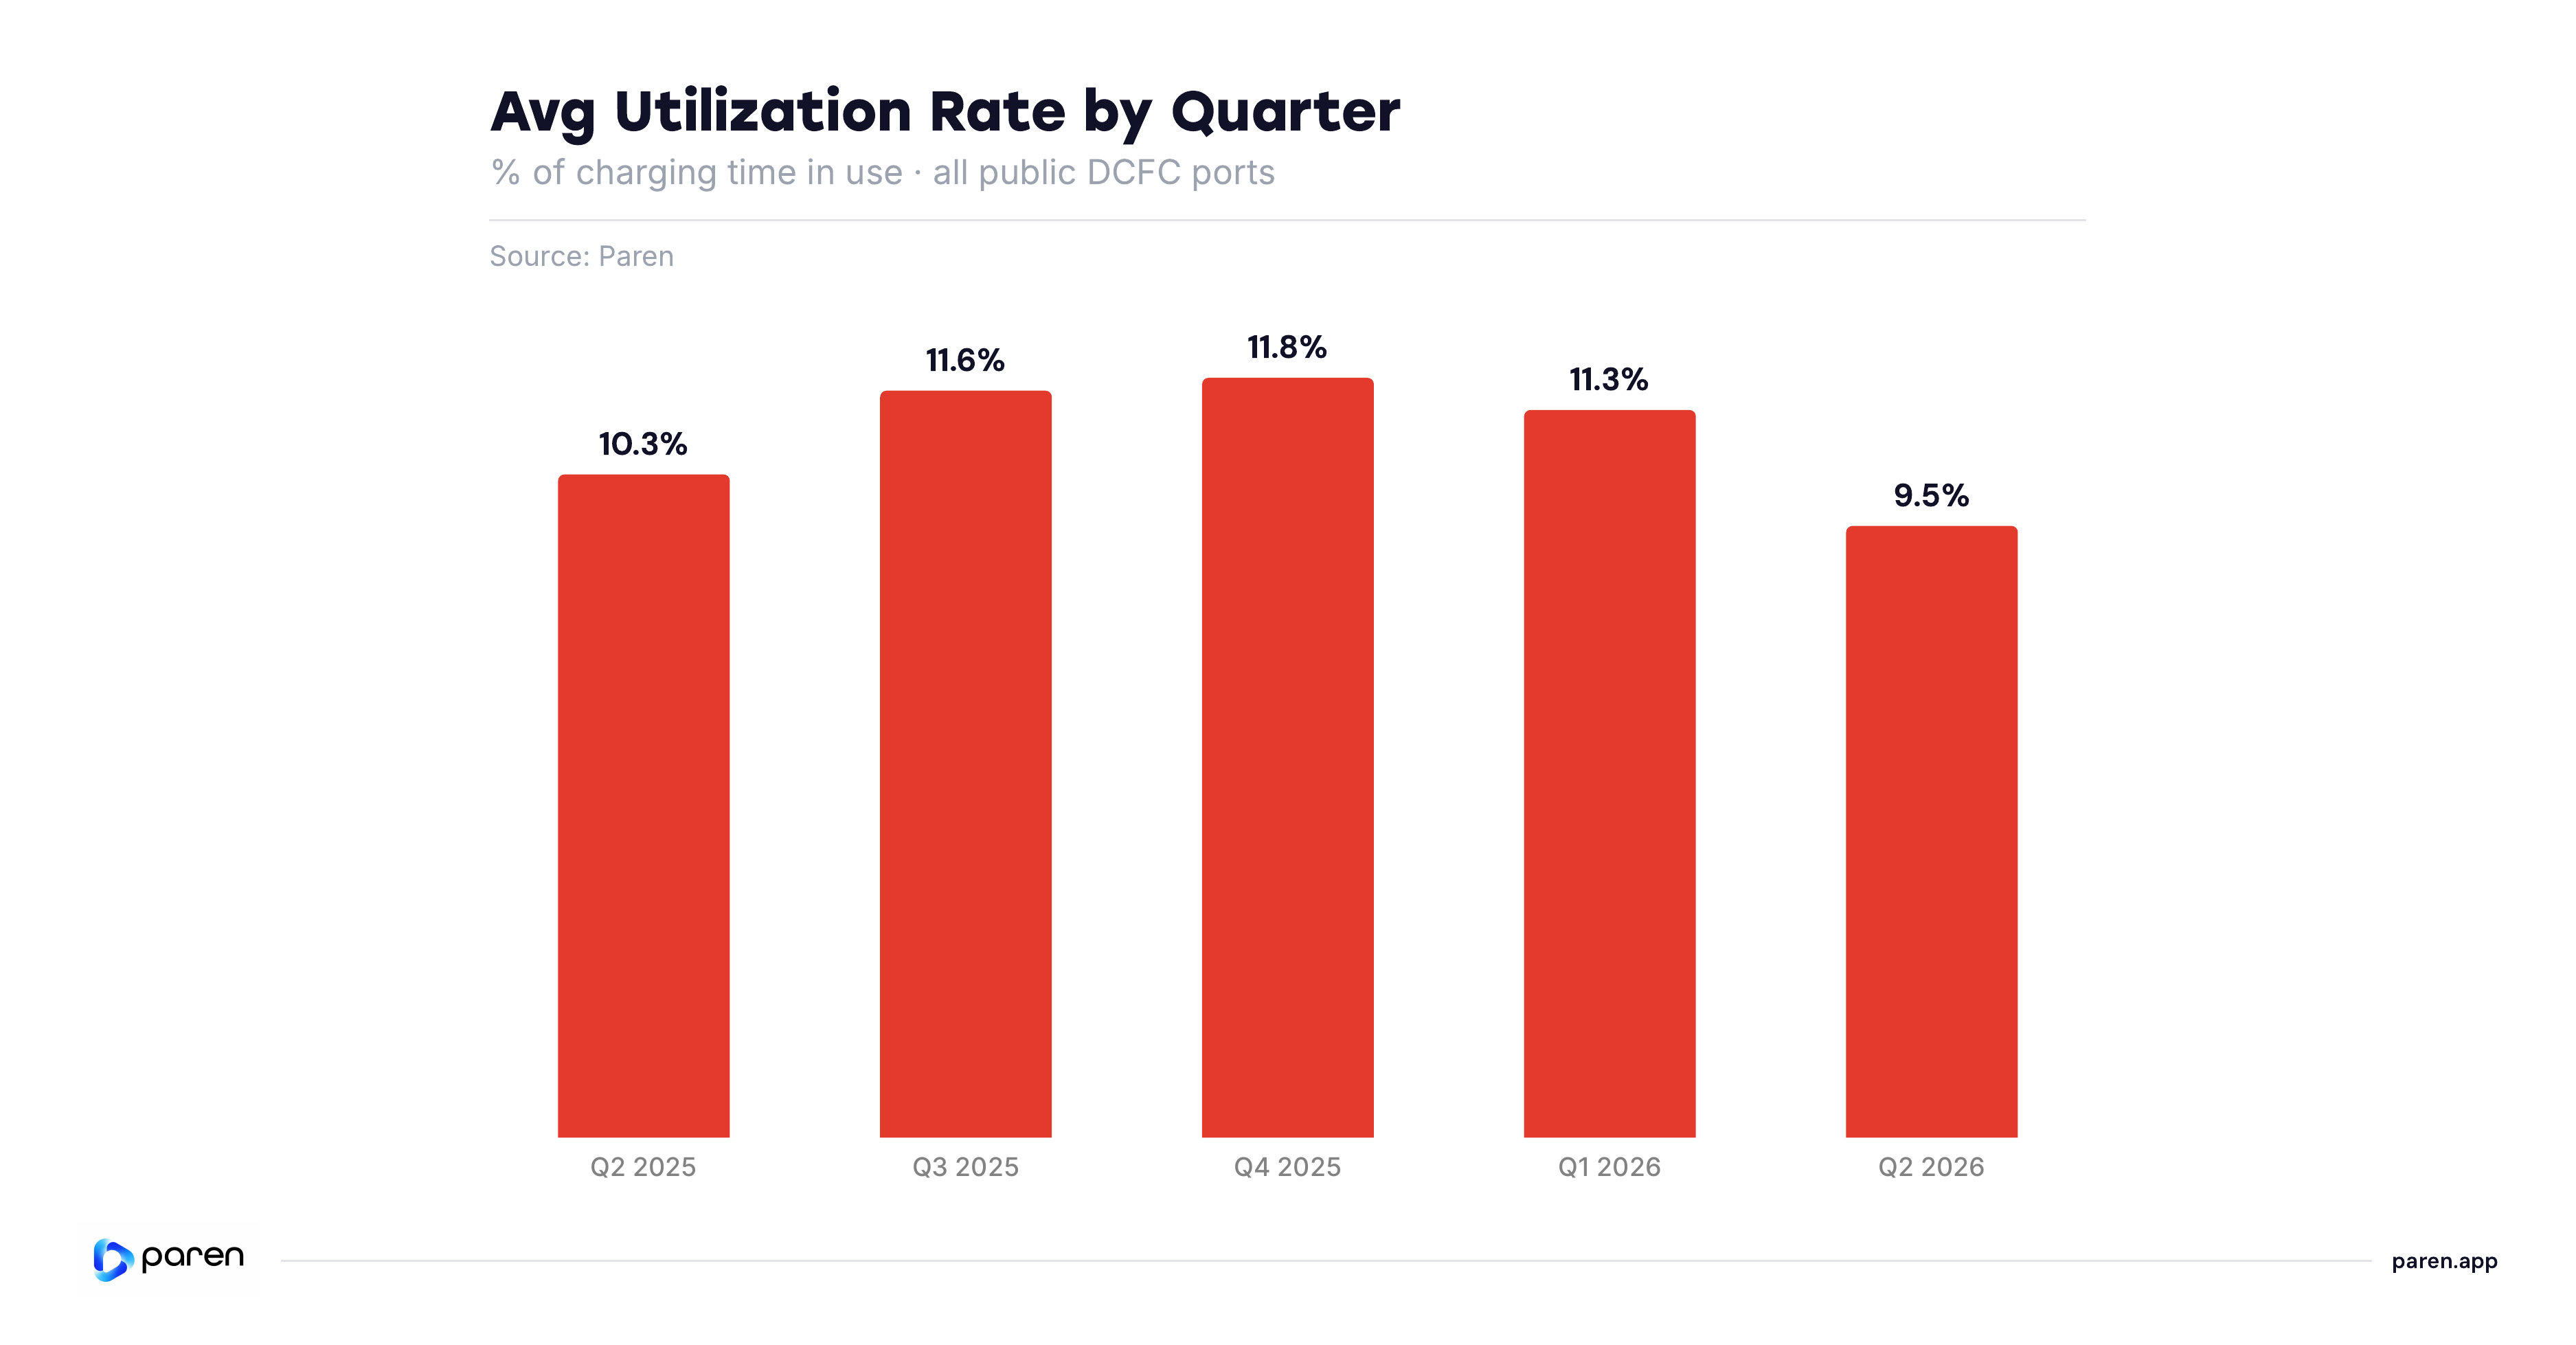
DEMAND KEPT PACE WITH THE BUILD THROUGH 2025 — THEN THE GAP OPENED IN 2026.
The national utilization rate climbed from 10.3% in Q2 2025 to an 11.8% peak in Q4 2025, then eased to 11.3% in Q1 2026 and to 9.5% in Q2 (April–June) — the first sustained step-down after a year holding in the roughly 11–12% range.
PORTS ARE NOW GROWING FASTER THAN DEMAND CAN FILL THEM.
The reporting port base expanded roughly 42% over the five quarters, and Q2 added 409 new ports (page 6). Newly energized ports open at low initial utilization and take several quarters to ramp, so a fast build phase mechanically dilutes the national average before demand catches up — most visibly outside the dense Ontario, British Columbia and Québec cores where new sites are still maturing.
THE DECLINE IS A REAL SUPPLY-VERSUS-DEMAND SHIFT.
The national rate is an exposure-weighted average over thousands of ports, so the utilization decrease reflects a real supply-versus-demand shift as port growth is currently outpacing demand.
B.C., Ontario and Québec Lead – but Ease as the Gap Compresses
THE THREE BIG MARKETS STILL LEAD, BUT ALL EASED OFF Q1.
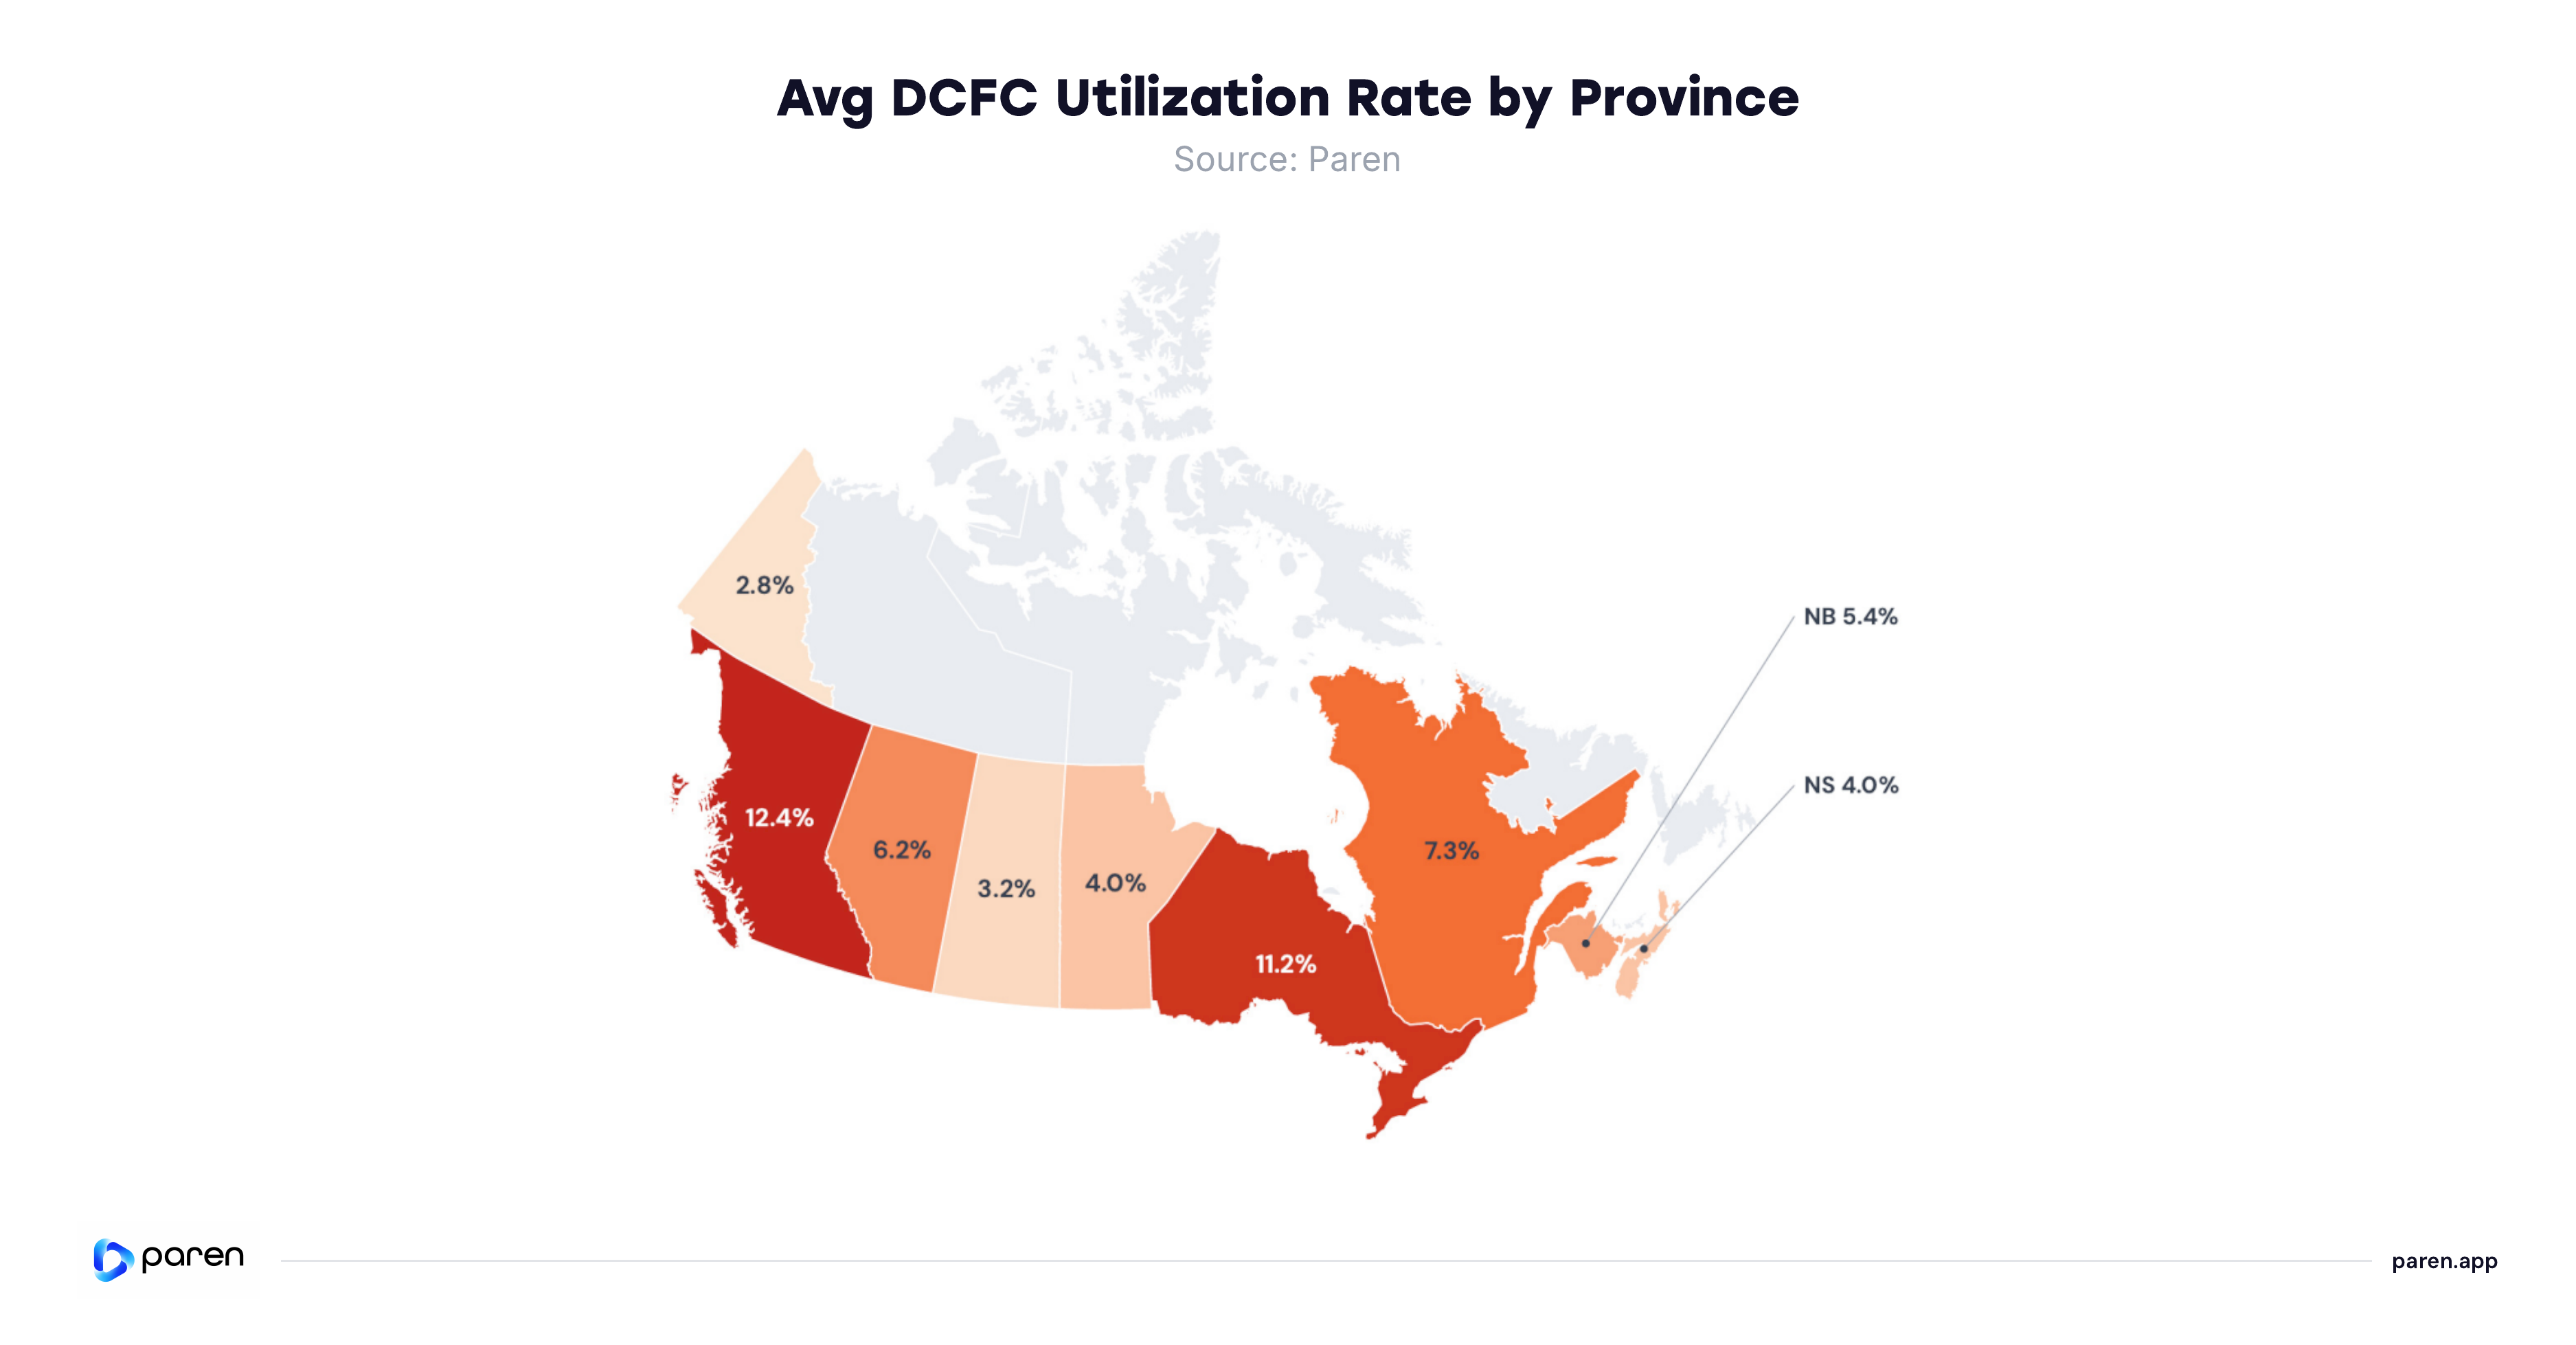
British Columbia (12.4%) leads, Ontario (11.2%) is close behind and Québec (7.3%) third. All three softened from Q1 (Ontario 13.9%, British Columbia 13.2%, Québec 10.7%), with Québec down the most.
THE DROP TRACKS WHERE THE DEPLOYMENT WENT — BUT IT IS MORE THAN DILUTION.
Québec, British Columbia and Ontario absorbed nearly all of Q2's new ports (roughly 120, 90 and 81 respectively) and are the only provinces where utilization fell (Québec –3.4 pts, Ontario –2.7, British Columbia –0.8); provinces with little new build held flat or rose (Alberta +1.0, New Brunswick +1.8, Saskatchewan +0.8). New ports dilute the average — but Québec's decline outpaces capacity growth alone, so seasonality and network mix also weigh.
LOW-DENSITY PROVINCES STAY AT THE BOTTOM.
Manitoba (4.0%), Nova Scotia (4.0%), Saskatchewan (3.2%) and Yukon (2.8%) trail on thin demand across existing capacity. Provinces under 10 reporting stations — P.E.I., Newfoundland & Labrador and the territories — are suppressed to avoid small-sample distortion.
Most Metros Ease on Near-Flat Supply – the Q2 Dip Is Demand, Not Oversupply
DEMAND STAYS HYPER-CONCENTRATED IN VANCOUVER AND TORONTO.
Vancouver led by a wide margin: Vancouver (22.6%) and Toronto at 17.3%, versus a national rate of 9.5%. The rest cluster around 8–14%. Nearly every metro eased quarter-over-quarter, but the two-city concentration did not budge.
THE DECLINE IS DEMAND-SIDE, NOT SUPPLY.
Utilization fell roughly 15–42% across the metros while their port bases stayed essentially flat Q1 to Q2 (Montreal +6; Vancouver –12 and Toronto –2 as long-offline chargers were cleared, the rest flat) — a drop that stalls against a flat denominator can only stem from softening demand. Calgary (+5%) and Edmonton (+2%) rose on the same flat supply, where Alberta's demand is still rising (page 14). The dip reads as the winter-to-spring seasonal fade — not oversupply.
NEW DEPLOYMENT IS LANDING OUTSIDE THE BIG METROS.
Québec added around 120 new ports province-wide in Q2 (page 14), yet Montreal's base grew by only 6 — the Q2 build is going to highway corridors and smaller markets, so new low-utilization ports drag the provincial averages while the metro cores fall for seasonal reasons. New build is expanding coverage into new areas rather than adding capacity in the busiest cities.

Reliability Holds Steady Near 91 – British Columbia and Ontario Recover
RELIABILITY TRACKS NETWORK COMPOSITION AND ASSET AGE, NOT QUARTERLY TRAFFIC.
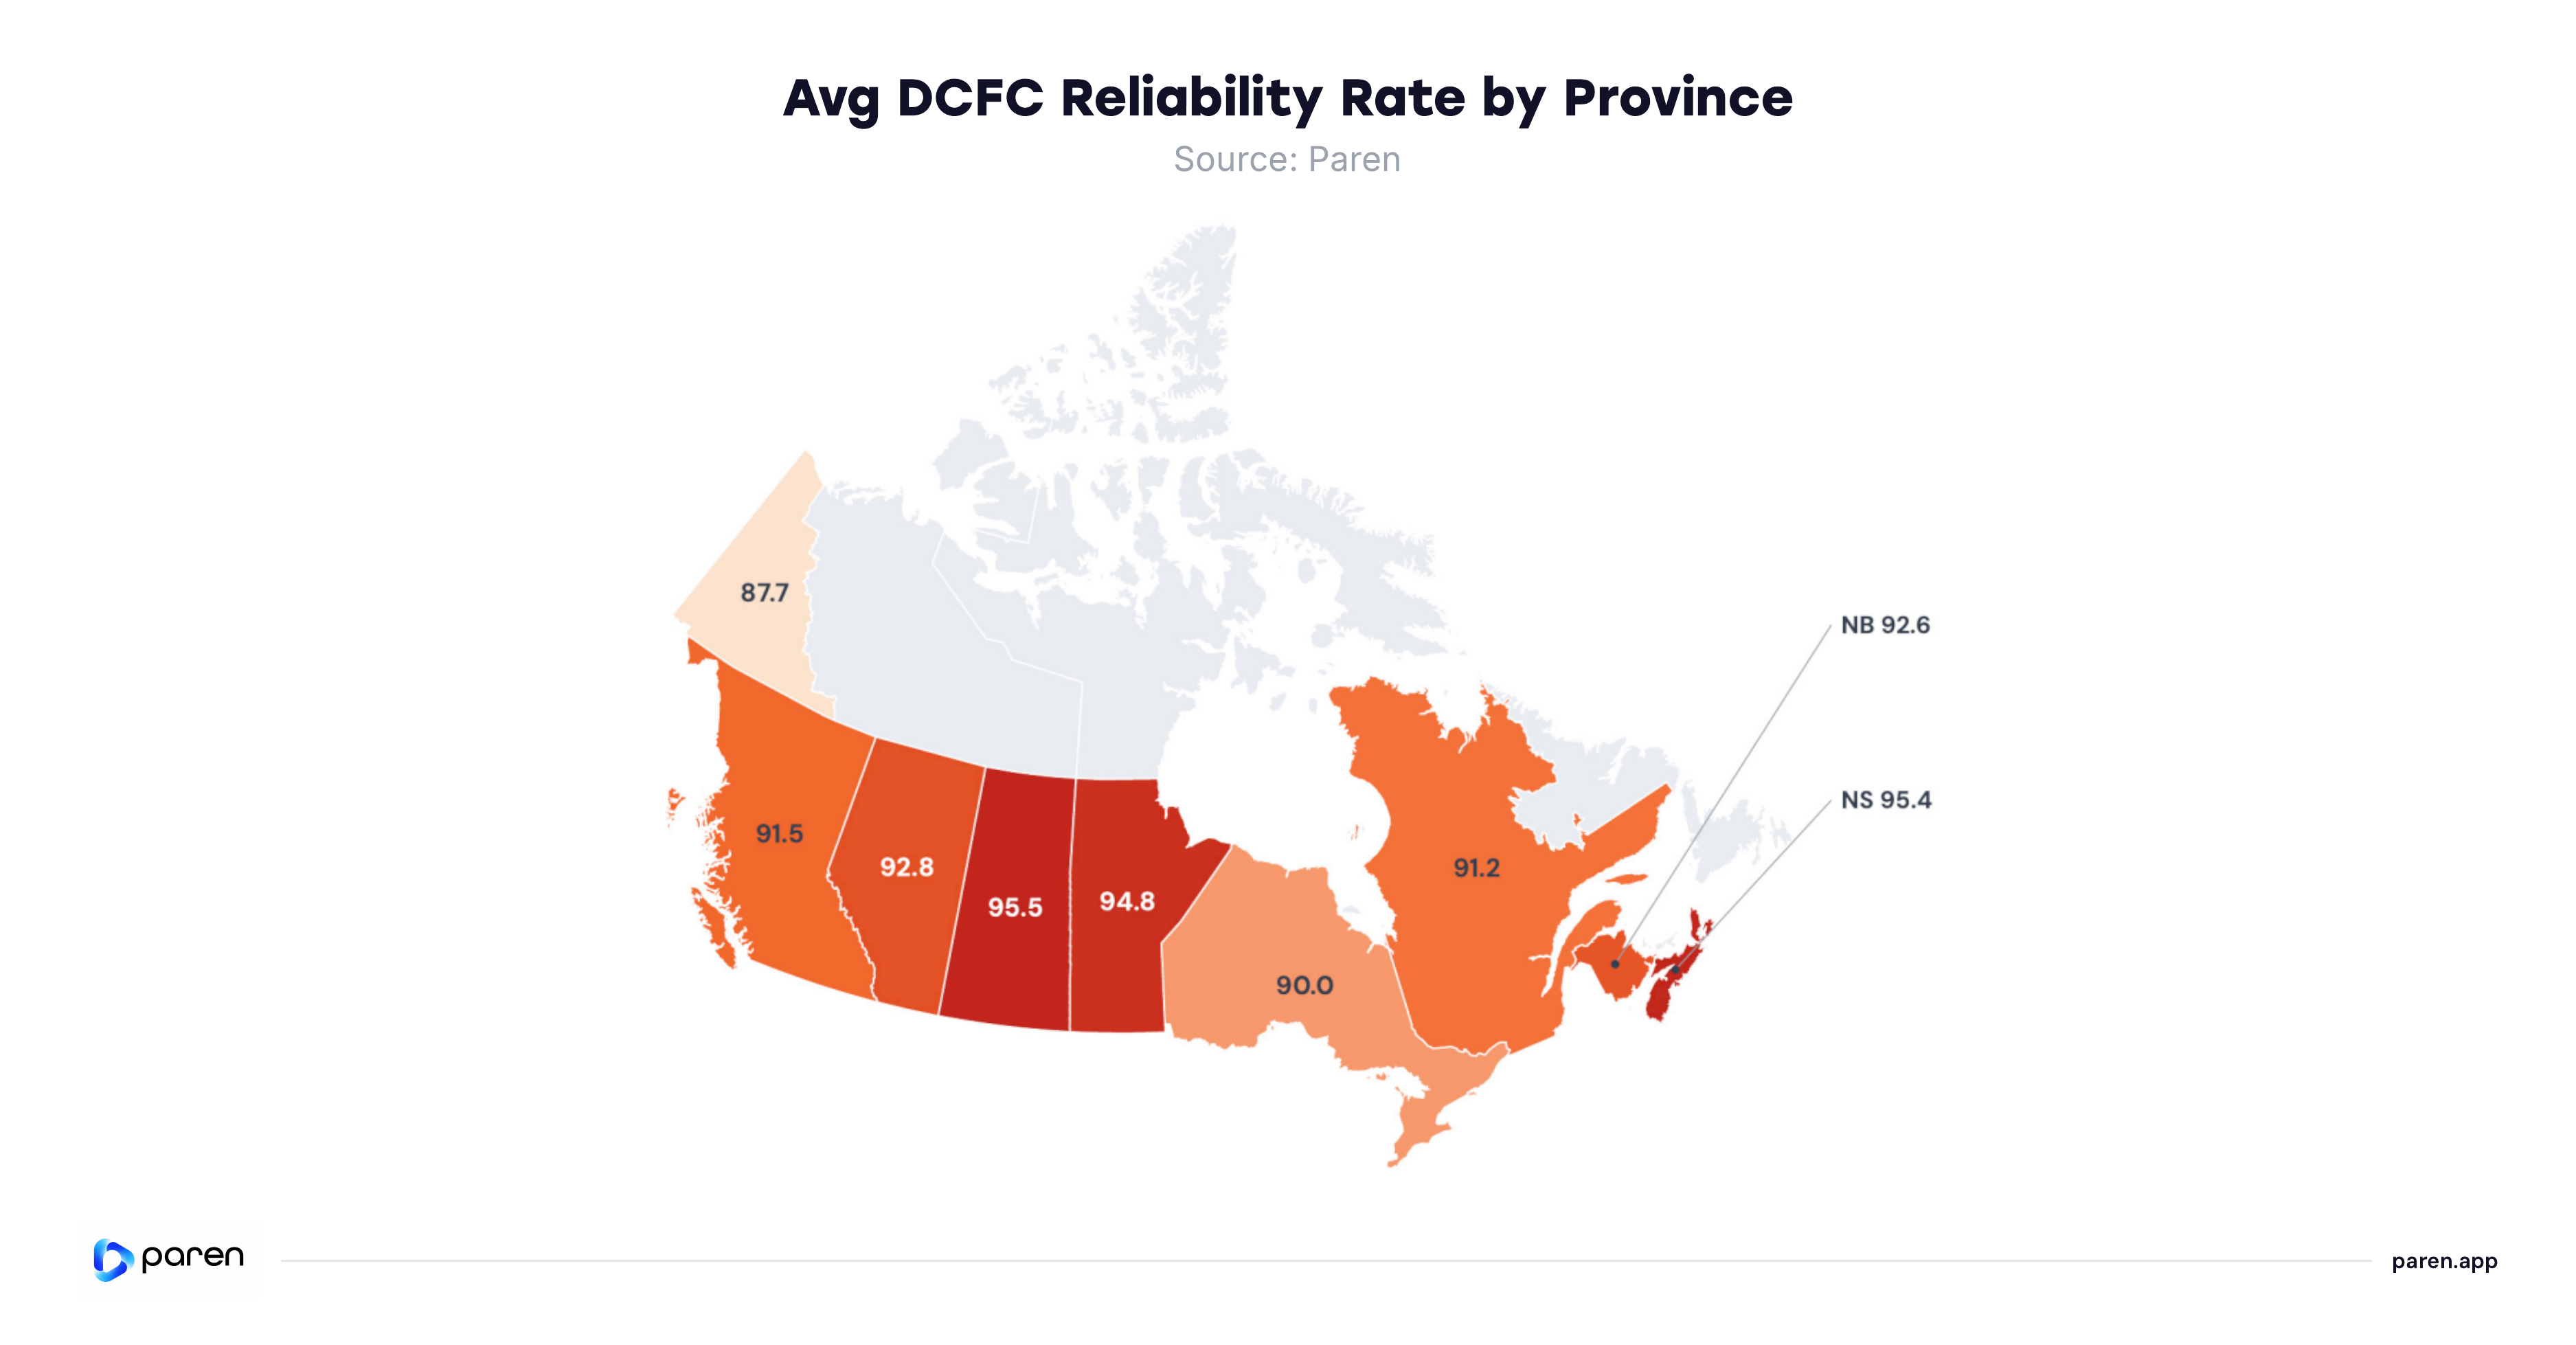
National reliability was 91.2 in Q2, up from a restated 90.3 in Q1. British Columbia (91.5) and Ontario (90.0) both recovered back above 90 after chargers was cleared from the fleet, leaving only Yukon (87.7) below the line. What moves the score is the mix of networks and how new the assets are — corridor and convenience-retail sites run well below the majors.
THE WEAK SPOT SITS IN CORRIDOR AND CONVENIENCE-RETAIL, NOT THE BUSY METROS.
The metros remain among the most reliable in the country; the softness concentrates in highway-corridor and convenience-retail sites, where operators run well below the majors. That is where uptime work pays off — not in densifying already-reliable city cores.
READ SMALL-PROVINCE MOVES WITH CARE.
Provincial gains are led by Yukon (87.7, up 5.4 pts) and Nova Scotia (95.4, up 4.4 pts), but Yukon rests on a thin base of around 21 stations — treat small-province swings with caution. The direction is robust: composition and asset age set reliability, not how hard chargers are used.
Utilization and Reliability Pull Apart – Network Mix, Not Congestion, Is Why
RELIABILITY, NOT USE, IS THE DIVIDING LINE.
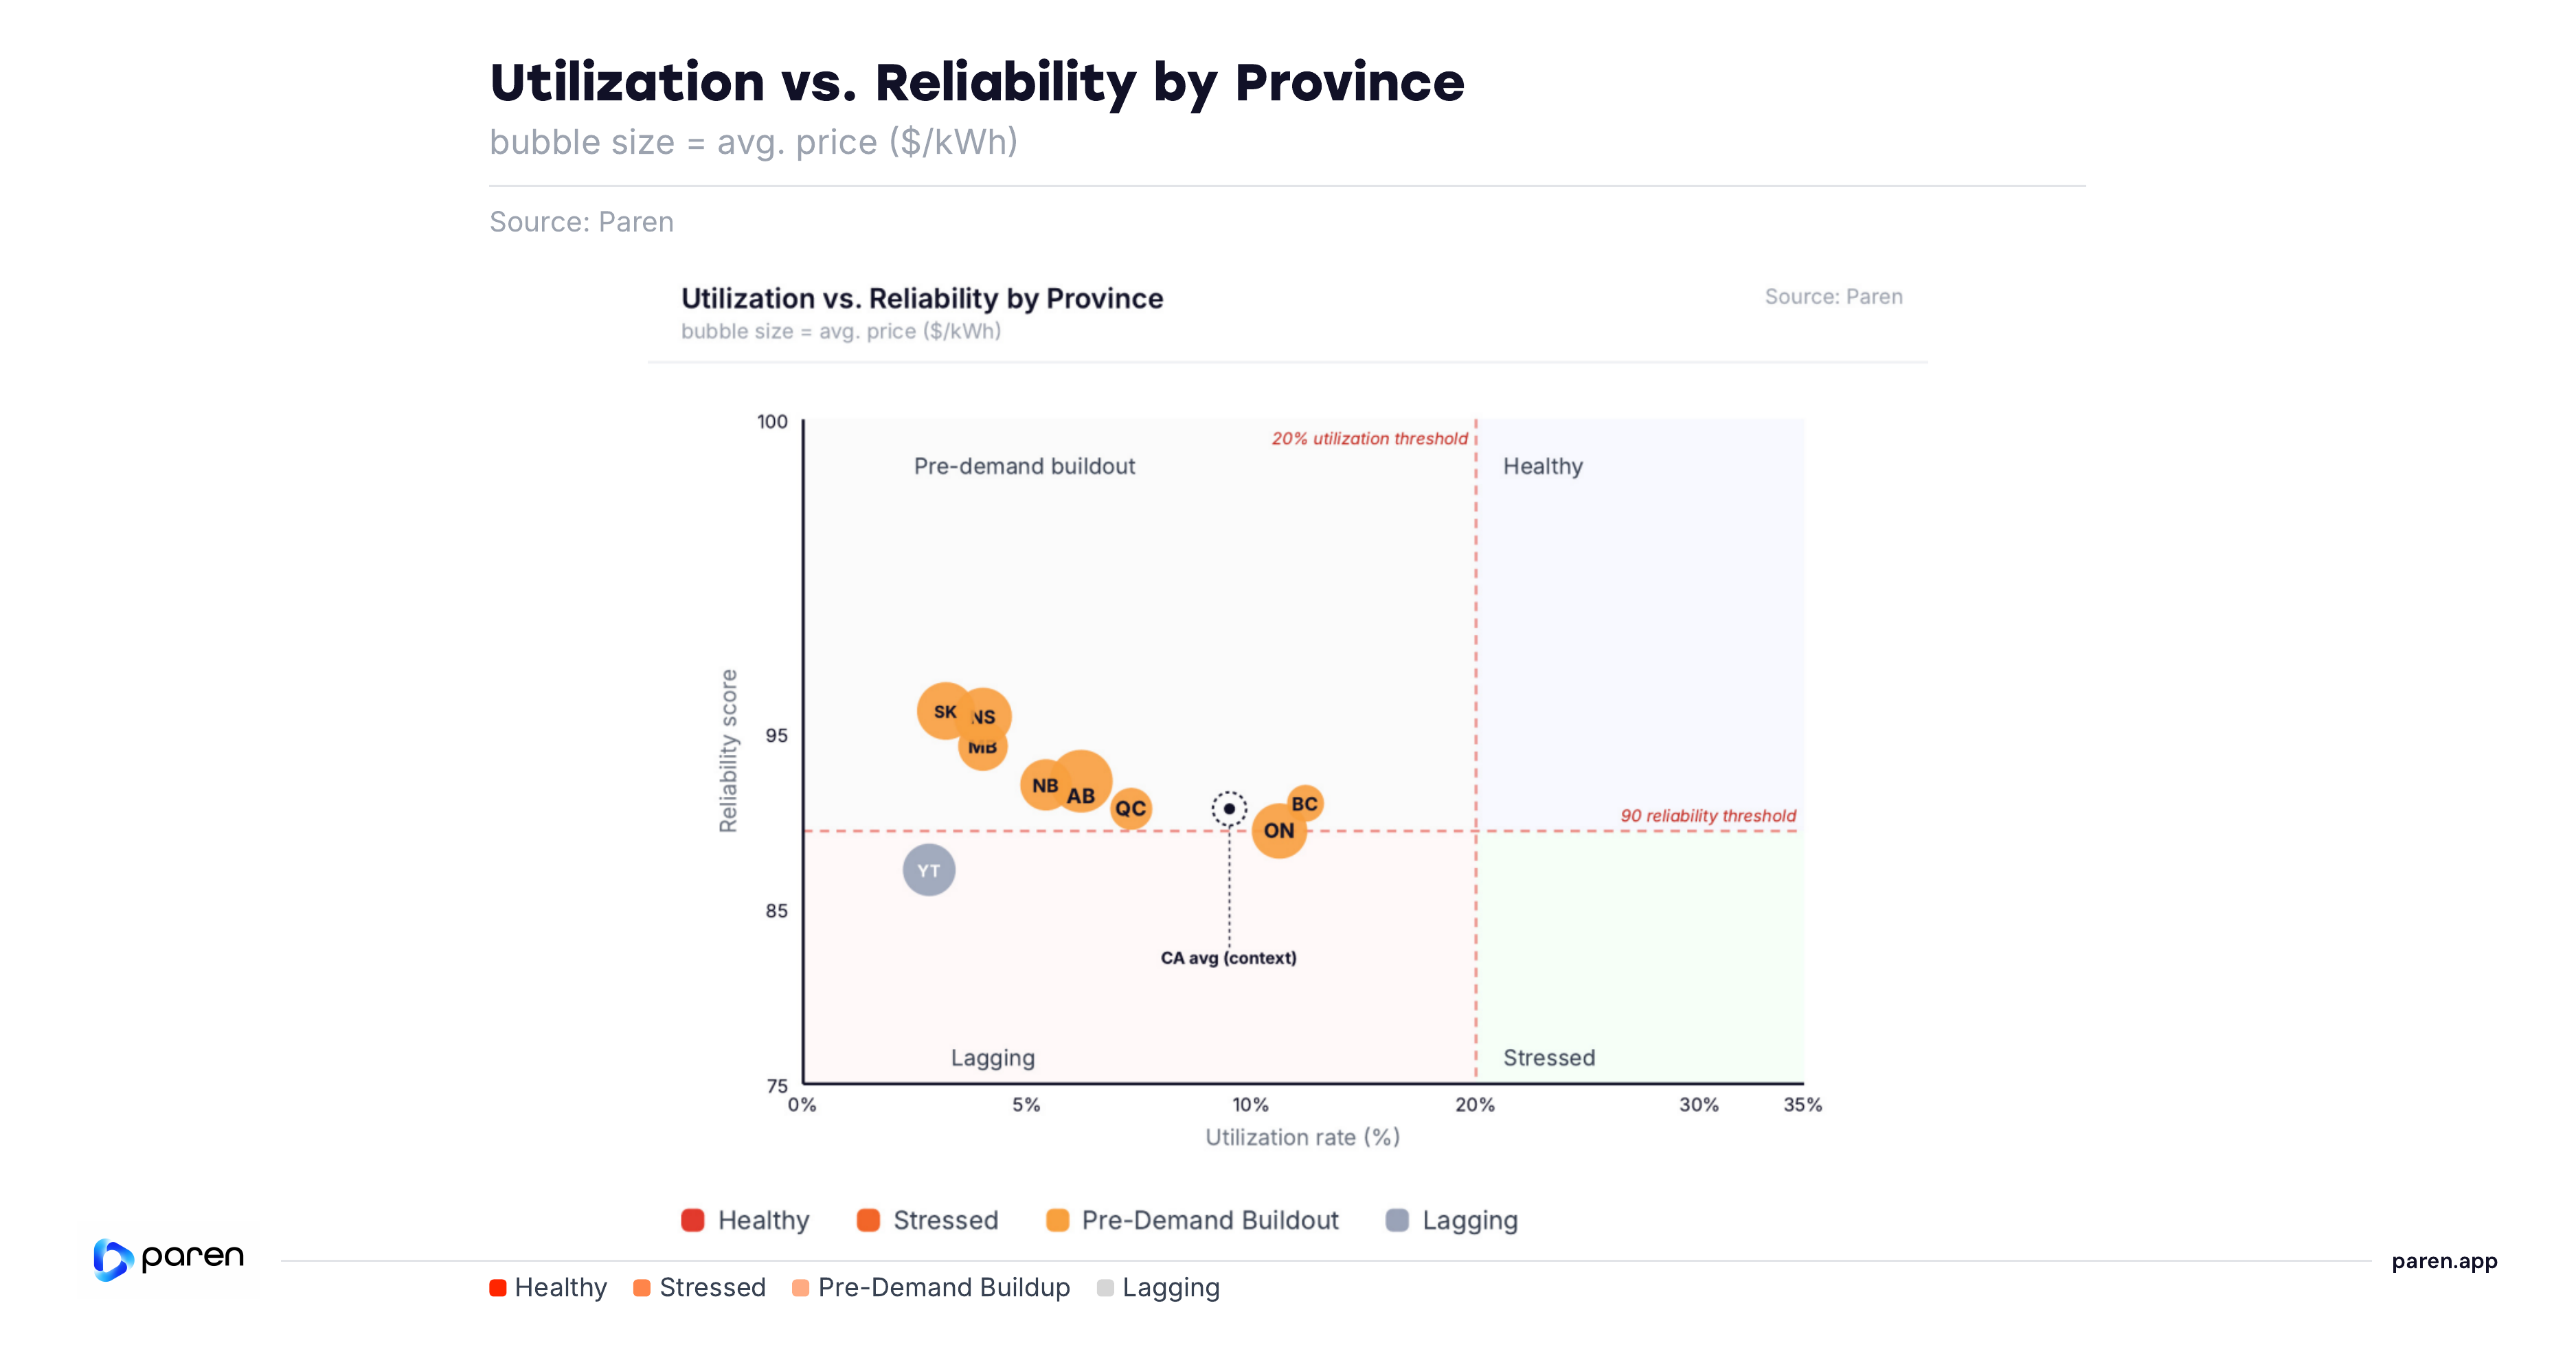
At a fixed 20% utilization / 90 reliability frame, no Canadian province is "stressed" (none reaches 20% use), so the map splits on the reliability line — only Yukon (87.7, the lone sub-90 province) falls below 90, and every other province now clears it. For national context, Canada sits at 9.5% utilization and 91.2 reliability.
RELIABILITY IS A NETWORK-COMPOSITION STORY.
The busiest networks stay reliable. British Columbia (91.5) and Ontario (90.0) carry the heaviest use yet still clear the line, so demand is not straining chargers; Yukon's sub-90 score reflects a small, thinly-used northern network rather than congestion.
PRICE IS A THIRD, LOOSER LENS.
Lower-priced British Columbia (around $0.42/kWh) pairs with the highest use; higher-priced Alberta and Saskatchewan (around $0.62–$0.67) with the lowest. Ontario breaks it — price shapes demand at the margin but doesn't explain the reliability spread.
WHAT TO WATCH IS SPECIFIC, NOT SYSTEMIC.
The reliability risk sits with specific corridor and convenience networks (page 16) rather than any whole province — the fix is operator-level uptime, not densification. Québec is a clean case: its heavy Q2 buildout pulled utilization below the national average, but reliability stayed strong at 91.2.
Section 3: EV Charging Pricing
Provincial Prices Stay Dispersed as Market Structure Sets the Floor
WIDE PROVINCIAL DISPERSION PERSISTS, BROADLY IN LINE WITH Q1
Average prices run from $0.42/kWh in British Columbia to $0.67 in Alberta — a roughly 60% spread — with a national average near $0.50. That $0.50 midpoint is not a rate drivers actually pay. The province you charge in swings the price far more than the time of day, so the national figure is a midpoint, not a rate drivers face.
PRICE TRACKS ENERGY COSTS, UTILITY FOOTPRINT AND MARKET STRUCTURE MORE THAN LOCAL DEMAND
Hydro-rich, regulated British Columbia ($0.42) and Québec ($0.47) anchor the low end. Alberta ($0.67), Saskatchewan and Nova Scotia (both $0.62) top the range on higher energy costs — little changed from Q1.
STABLE QUARTER-OVER-QUARTER, BUT EASING YEAR-OVER-YEAR AT THE TOP
The national average held near $0.50, but higher-cost provinces eased over the year: Alberta $0.67 from $0.72, Saskatchewan $0.62 from $0.68, Ontario $0.60 from $0.64 and Manitoba $0.54 from $0.61 — roughly 5–11% lower. British Columbia and Québec, already cheapest, held flat: compassion at the top, not a broad move.
PRICING IS STRUCTURAL, NOT DEMAND-DRIVEN
Provincial ranks barely moved despite the quarter's sharp utilization swings (pages 13–15): prices are set by policy, electricity cost and market structure.

A Year-Long Migration to Fixed Per-kWh Pricing Is Reshaping the Mix
FIXED PER-KWIH HAS QUIETLY BECOME CANADA'S MOST COMMON PRICING MODEL.
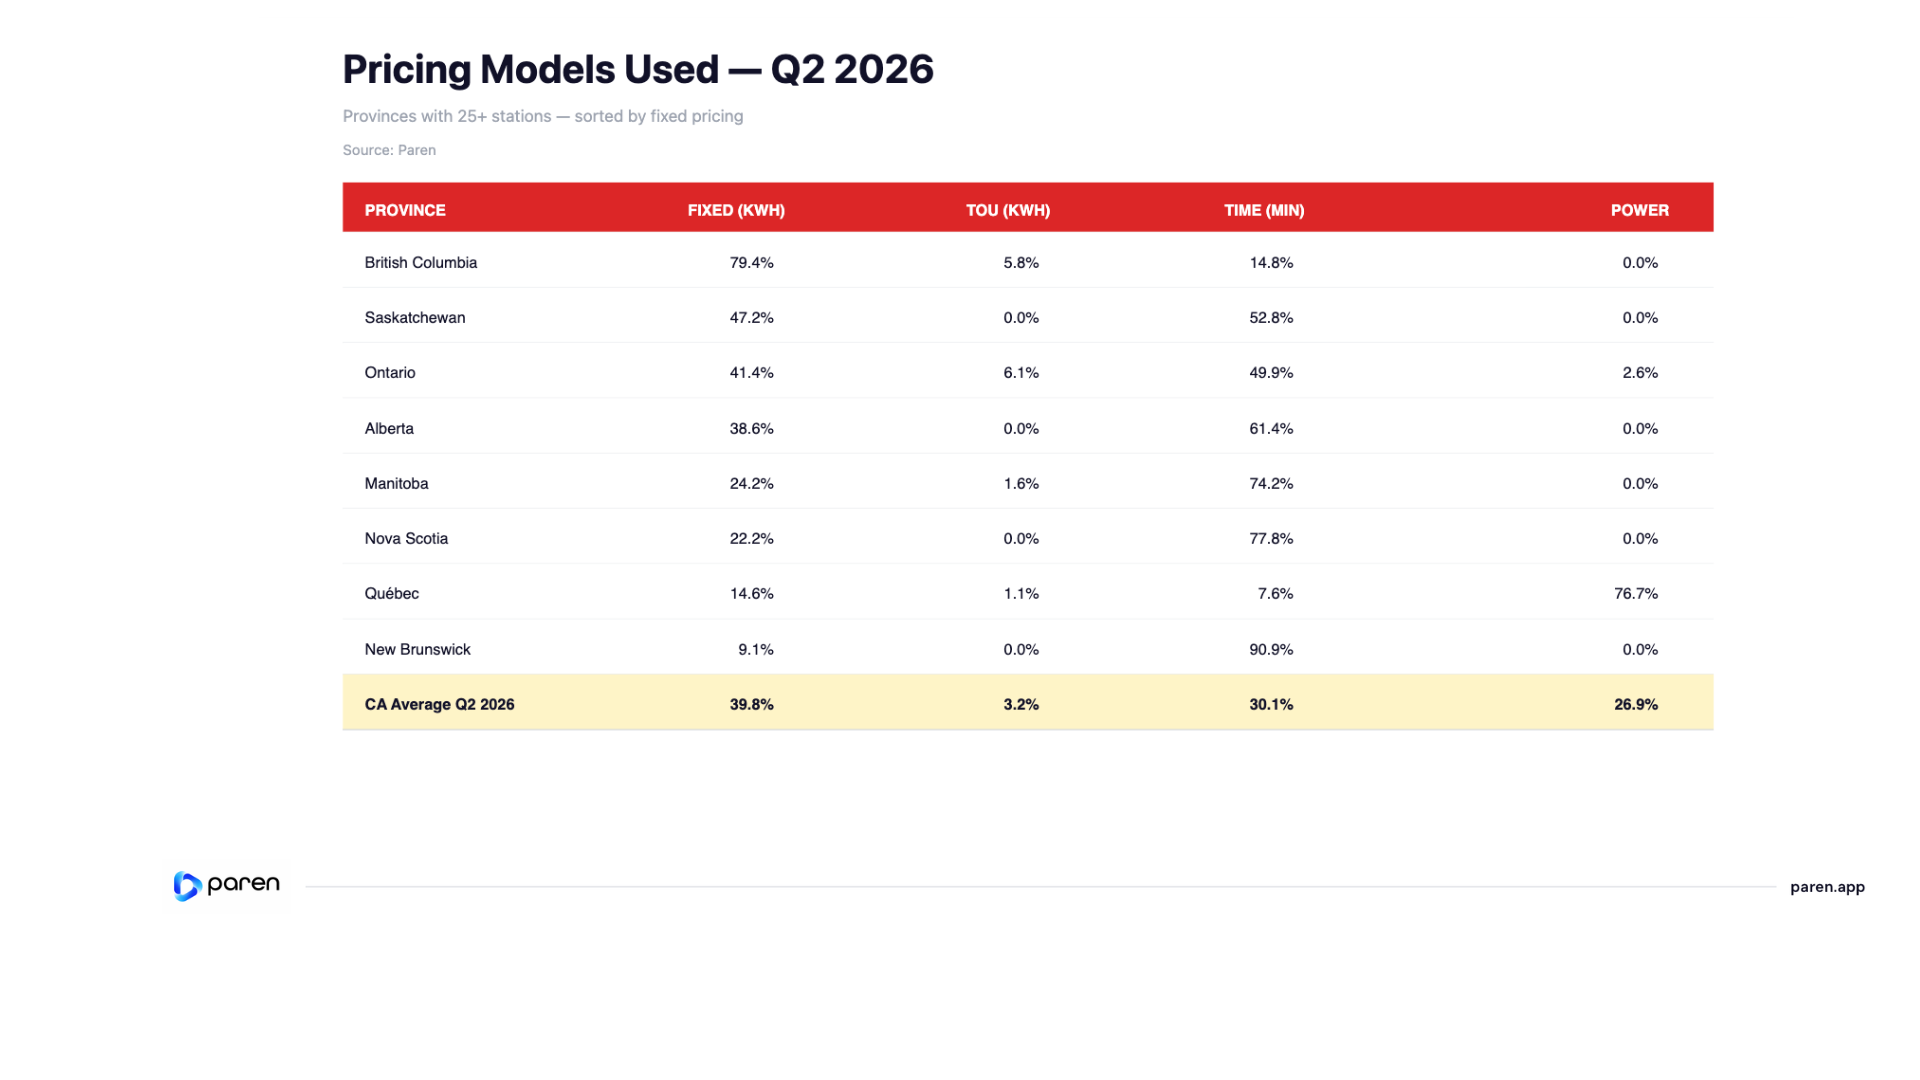
Nationally the mix is now fixed per-kWh 39.8%, time-based per-minute 30.1%, power-based 26.9% and time-of-use (kWh) 3.2%. A year ago fixed sat second behind time; it has since moved into first — a real change in how Canadian fast charging is priced, even if the four-way split stays fragmented.
LITTLE MOVED THIS QUARTER — THE SHIFT IS ANNUAL.
Quarter-over-quarter the shares barely moved — fixed rose just 0.3 points from Q1. The real change shows only year-over-year: the real shift shows year-over-year (31.1% → 39.8%), while time-based fell 4.4 points (34.5% to 31.0%) and power-based fell 5.0 points (31.9% to 26.9%). Pricing structure shifts on a multi-year market cadence, not a quarterly one.
THE MOVE TOWARD FIXED PER-KWH PRICING IS BROAD, BUT NOT MANDATE-DRIVEN.
Provincial rules and market structure shape what is possible; operator choices determine how quickly the mix changes. Ontario and Alberta led the year-over-year shift (Ontario 27% → 41%, Alberta 30% → 39%), while Québec, the Prairies and Atlantic provinces still reflect distinct local pricing models.
Section 4: Appendices
Appendix A: Terminology
Charging Infrastructure
CPO — Charge Point Operator
Fast Charging — Charging port of a minimum of 24 kW
NACS — North American Charging Standard; Tesla's charging connector now adopted by many networks.
ZEVIP — Zero Emission Vehicle Infrastructure Program; federal EV charging funding delivered by Natural Resources Canada.
Connector — A charging plug conforming to CCS, CHAdeMO, or NACS (J3400) standard
Port — A charging unit with one or more connectors capable of charging one EV.
Station — A physical location with one or more EVSEs (charging ports).
Utilization & Reliability
Reliability Index — The Paren-specific calculation that measures charger reliability taking into account recent successful charge sessions with and without retries, failed charge attempts, and station downtime over a specific time period.
Tesla — Tesla is a reference to the Tesla Superchargers
Utilization — The percentage of tracked time spent on both successful and unsuccessful charging activity at a charger over the time period open per day.
EV Charging Pricing
Fixed Price — Refers to a consistent rate per kWh for the entire charging day.
Time-of-Use (TOU) — Pricing changes based on the time of day with higher prices during expected peak demand time. It encourages off-peak charging and can help balance grid demand.
Dynamic Pricing — Pricing changes based on an ad-hoc changes not tied to a specific time. Typically, dynamic pricing daily spreads are within the same minimum and maximum of the TOU model.
Time — Charges by the minute or hour. Often used where energy-based pricing is restricted.
Appendix B: Methodology
Changes in 2026
Continuous Refinement: We introduced targeted refinements to improve accuracy and better reflect real-world market conditions. Some figures may differ slightly from earlier editions. Most notably, in Q2 2026, our session counting methodology improved across busy charging stations, resulting in more tracked, successful charging sessions.
Infrastructure Methodology: We enhanced how we measure station growth and identify new stations, reducing reliance on AFDC open-date fields and incorporating additional signals for more accurate activation timing.
Pricing Methodology: We updated our average pricing model to exclude free chargers from calculations to reduce distortion. Prior-quarter figures were recalculated using this updated methodology for comparability.
Port-Count Universes: Port counts vary by analysis because the report uses different validated data universes. Network-size figures use Paren's reconciled installed DCFC port base. CPO market-share tables use the subset of installed ports that can be attributed to a charging network/operator. Sessions, utilization and reliability use ports within Paren's real-time observed coverage for the reporting period.
These totals answer different questions and should not be read as competing counts. Installed-base figures describe network scale; operator-attributed figures support leaderboard and market-share analysis; observed-coverage figures support performance metrics such as sessions per port, utilization and reliability.
Appendix C: Data Sources
- Paren Public Charging Infrastructure Dataset
- AFDC
- Select ZEVIP and provincial EV infrastructure funding award data
- Proprietary charging session / utilization models
Report Team



Paren is regularly featured in leading news outlets such as The Wall Street Journal, The Washington Post and The New York Times, as well as industry-specialized outlets such as Electrek and InsideEVs.
Read More ↗
Want the data behind the data?
Access utilization, reliability, and pricing at the station level across 95%+ of US and Canadian DCFC infrastructure.