US EV Fast Charging — Full Year 2025
Despite concerns about a slowdown in EV adoption, 2025 proved to be a breakout year for U.S. fast charging.This report analyzes how infrastructure, utilization, pricing, and reliability evolved across the full year—revealing a sector that scaled rapidly, met real-world demand, and continued to mature operationally.
Introduction
The U.S. fast-charging industry entered 2025 amid growing questions about the pace of electric vehicle adoption and infrastructure investment. While broader market narratives suggested a slowdown, activity across public fast charging told a more nuanced—and ultimately more constructive—story.
This report examines how the U.S. fast-charging network evolved over the course of 2025, with a focus on infrastructure deployment, utilization, pricing, and operational reliability. Together, these metrics provide a clear view into whether charging networks are scaling sustainably and meeting real-world demand.
Paren was founded to address one of the industry’s core challenges: access to reliable, real-time intelligence on charging infrastructure performance. Today, Paren processes over 100 million data events per day and monitors more than 95% of U.S. DC fast-charging infrastructure in real time. This coverage enables a comprehensive, ground-level view of how charging networks operate across geographies, operators, and market conditions.
The following executive summary highlights the key findings from Paren’s full-year 2025 analysis. Subsequent sections provide deeper detail on the underlying trends shaping the fast-charging ecosystem.
The Paren Team
Report Overview & Highlights - Full Year 2025
2025 was a record-breaking year for U.S. fast-charging infrastructure, defying the prevailing narrative of a broad slowdown in EV adoption. Despite a more cautious market backdrop, the fast-charging sector saw rapid expansion, strong demand growth, and continued improvements in operational performance.
Infrastructure scaled rapidly: +30% YoY adding over 18K new DCFC ports
U.S. fast-charging networks expanded meaningfully in 2025, adding approximately 18,000 new DC fast-charging ports, a ~30% year-over-year increase. Deployment increasingly favored larger, higher-capacity stations, reflecting a continued shift toward sites designed for higher throughput and sustained utilization.
Fast-charging demand reached a record 141M sessions, increasing by +30% YoY
Public fast-charging usage grew in lockstep with infrastructure expansion. In 2025, the U.S. fast-charging networks provided an estimated 141 million charging sessions, a record, up roughly 30% year over year, confirming that rising EV adoption translated directly into increased network usage rather than excess idle capacity.
Pricing remained stable as reliability improved nationwide
Despite rapid growth in both ports and sessions, average utilization rates remained broadly stable, indicating that new capacity was effectively absorbed. At the same time, pricing stayed largely unchanged, while reliability improved across most markets, signaling increasing operational maturity as networks scaled.
Review the following pages for in-depth analysis of these trends. For even deeper insights, please reach out to us at hello@paren.app for a demo, conversation, or general Q&A.
The Paren Team
2025 confirmed that U.S. fast charging can scale • Infrastructure expanded without diluting utilization • Demand growth matched capacity growth • Pricing stabilized as networks matured • Reliability improved across most markets — The Paren Team
2025 confirmed that U.S. fast charging can scale
• Infrastructure expanded without diluting utilization
• Demand growth matched capacity growth
• Pricing stabilized as networks matured
• Reliability improved across most markets
The Paren Team

Charging Infrastructure Expansion
2025: A Record Deployment of DCFC Ports
Over 18K DCFC new ports deployed in 2025, driven by a record breaking Q4
The accelerated deployment of new ports in Q4 2025 shattered all records. Operators deployed 44% more ports in Q4 2025 than the year before with a total of 5,769 ports.
New DCFC port deployments increased by 30% year-over-year in 2025
Following 14K new ports deployed in 2024, more than 18K ports from all networks opened to EV drivers across the US in 2025.
Exceeding market expectations and our prior deployment estimates
The astonishing infrastructure growth defies the public narrative of a slowing EV market. Momentum is increasingly driven by private operators rather without any new federal stimulus.
In our Q2 2025 report, we ambitiously estimated that 16.7K new ports would be deployed by the end of 2025. We underestimated the growing average number of ports available at new stations and the ability for Tesla to continue their pace (+13% ahead of our prediction). We did not account for the significant ramp up capabilities of Mercedes Benz HPC(+193%), Ionna(+48%), and Red-E(+43%). On a smaller scale, several other CPOs outperformed our estimates leading to this massive increase for 2025.
An increase in supply to meet a growing demand
Alongside this rapid port deployment, nationwide utilization rates remained stable, indicating that supply expansion is demand-led rather than speculative. This could be driven by many factors including the increased confidence of drivers in the charging infrastructure, new personas (ride share drivers), and an emerging cohort of drivers who cannot charge at home easily.
While infrastructure remains ahead of demand, utilization levels suggest demand is now sufficient to support CPO economics and continued private-led expansion.

Non-Tesla Networks Increase Ports per Station
Tesla continues to roll out large, sometimes mega, Supercharging stations
Across 2025, Tesla continued to operate stations with a higher port density than non-Tesla networks, reinforcing its long-standing emphasis on large, high-capacity sites. In 2025, Tesla deployed 353 stations with 10 or more ports. The largest Tesla site in Lost Hills, CA now stands at 164 ports.
Tesla’s average ports per station remained consistently in the mid-teens throughout the year—peaking at 15.0 in Q2 and ending Q4 at 14.4—well above the broader market.
Non-Tesla networks are adopting a similar playbook
Non-Tesla networks, while still operating smaller sites on average, showed a gradual increase in ports per station over the same period. The average ports-per-station ratio rose from 3.6 in Q4 2024 to 4.5 by Q4 2025, reflecting a steady shift toward higher-capacity deployments as networks scale and standardize larger builds. In 2024, non-Tesla networks added 74 stations with 10 or more ports. In 2025, that number ballooned to 184! We expect a similar doubling of this stat in 2026.
The narrowing gap does not suggest convergence, but rather parallel scaling strategies: Tesla maintaining its large-site model, while non-Tesla operators catch up by deploying more capacity per location. Together, this supports the broader trend seen across the industry in 2025—capacity growth increasingly driven by more ports per site, not simply more sites.

Tesla Leads Deployment but Loses Market Share as the Market Broadens in 2025
Tesla had an impressive year. So did the rest of the market.
Tesla remained the dominant public fast-charging operator in 2025, adding 6,786 Supercharger ports—more than the next nine operators combined (6,126). However, Tesla’s share of new deployments declined to 37.6% as total market expansion outpaced any single operator’s ability to scale.
More players operating in the US market
The number of network or charge point operators grew to over 120 in 2025. Another metric is striking: the long tail of operators aggregated under “Other Networks” nearly doubled the number of ports deployed in 2025. While there has been some consolidation and market exits in 2025, the number of new players has more than accounted for them. We expect this trend to continue as we see programs like Tesla Supercharger For Business bringing new, more regional players into the market.
The steep increase in ports deployed is multi-faceted
Operators have entered the market with unique strategies, most of the time appealing to a specific segment of EV drivers. We observed:
- Regional operators
- OEM-backed networks
- Co-located charging networks (retail, travel centers, fleets)
- Urban- and travel-centric networks
New operators will continue to enter the market, though consolidation is anticipated
The market is maturing and with that, so is the playbook to roll out a new charging station. Opportunistic players are entering with hyper-local strategies built on proven hardware and software. At the same time, aging stalls and under-performing stations are “ripped and replaced” by new hardware and sometimes consolidated under a new operator.
As a result, 2025 marks a transition from a scale-driven market to one defined by execution quality and asset efficiency.

Higher-Power DCFC Continues to Gain
2025 increases the default speed at the port level
Across 2025, newly opened DC fast charging ports continued to shift toward higher power levels, particularly among non-Tesla networks. The share of 250+ kW ports deployed increased quarter over quarter, rising from 27% in Q1 to 51% in Q4, while mid-range ports (150–249 kW) remained a steady component of new deployments.
By year-end, 24–149 kW ports represented a smaller share of new additions, reflecting a clear shift toward faster charging equipment.
Drivers expectations are shifting
New EVs are boasting peak charging speed as the holy grail. But now that charging ports are increasingly designed to sustain 250 kW, 350 kW, or even 400 kW+ output, drivers are demanding more of their own vehicles to sustain a high charging curve.
Paren will continue to monitor live reliability and performance as drivers increasingly favor sites where load balancing and throttling do not materially reduce charging performance.

NACS Adoption at Non-Tesla Networks Progresses
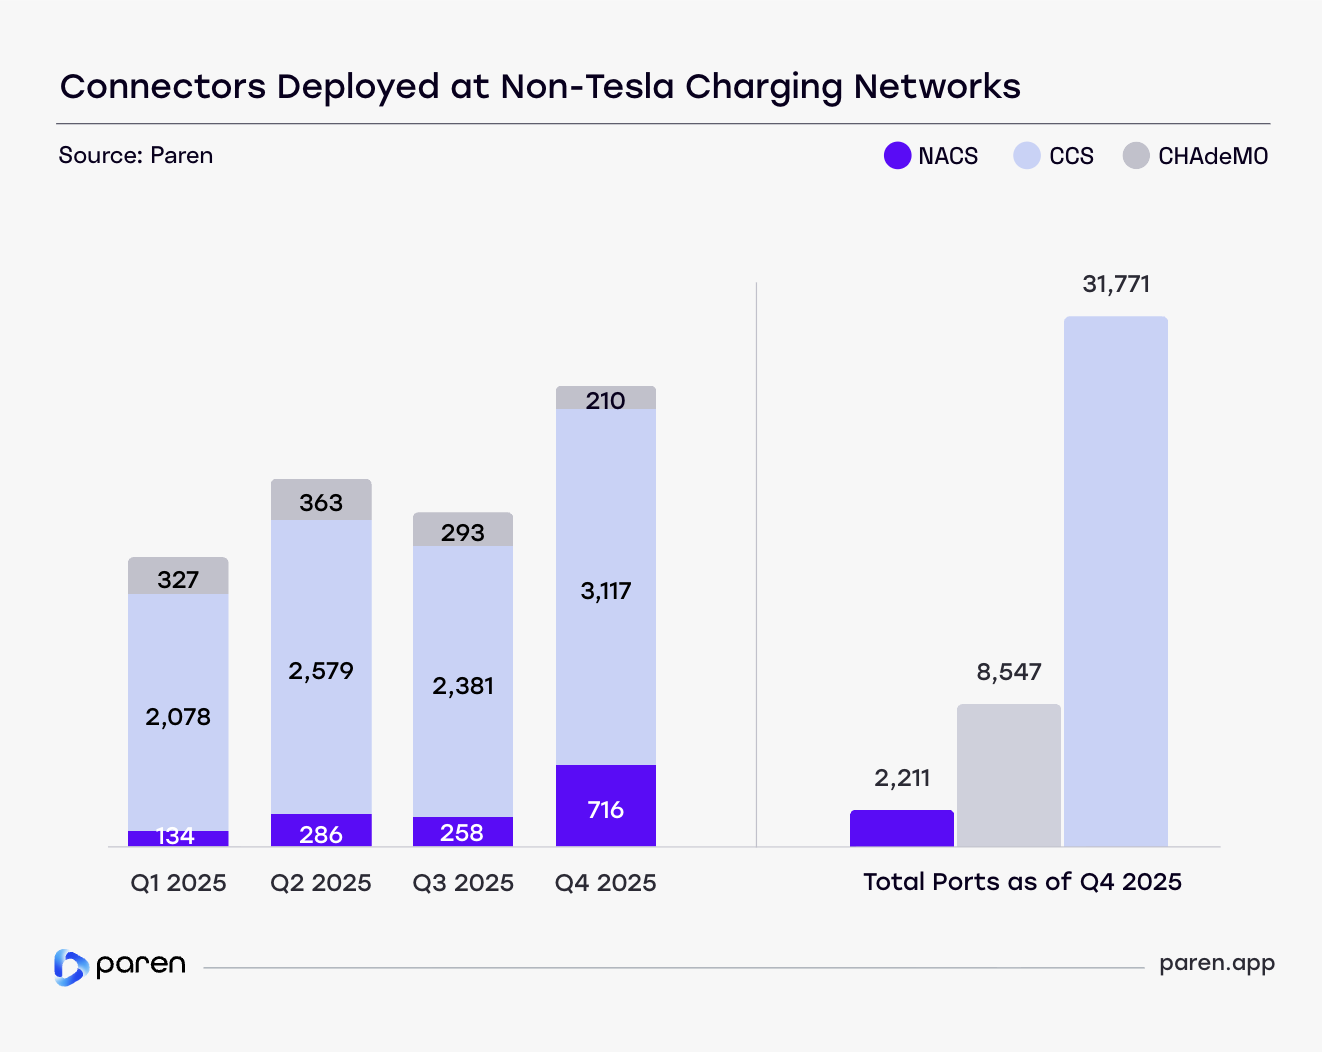
In Q4 2025, 18% of newly deployed ports at non-Tesla charging networks were NACS
The installed base of NACS connectors at non-Tesla networks more than doubled over the past six months, surpassing 2,100 ports nationwide. Growth has been driven primarily by Applegreen, bp pulse, Ionna, and Mercedes-Benz HPC through mixed CCS/NACS deployments and larger, multi-port sites.
Non-Tesla networks still run on CCS
As of Q4 2025, 75% of installed ports at non-Tesla networks remained CCS. NACS ports only stood for 5% of the total ports available outside of Tesla Superchargers.
Adapters will become standard before NACS becomes dominant
Based on current deployment trajectories, the non-Tesla NACS installed base is expected to roughly double again in 2026, driven by mixed-connector sites. Full industry-wide adoption of NACS will take years, leaving adapters as a practical requirement for broad network access in the near term.
Three States Lead a Market Embracing EV Adoption
California, Texas and Florida rolled out 37% of new ports in 2025
The leading states by ports deployed continued to meet the demand for fast public charging stations, rolling out 6,697 ports in 2025. Year over year, these three states grew more than the national average of 31%. It should also be noted that of these three, only Texas is deploying NEVI-funded stations at this time.
Mature states continue to grow driven by demand in leading metro areas
In the leading states, ports are deployed to meet a sustained demand that is yet far from satisfied. In metropolitan areas like New York City, Los Angeles, Miami and San Francisco, utilization rates average between 25% to 35%. At peak hours, the market is saturated and drivers are left with wait lines.
Remarkable increase in Illinois and Georgia
Illinois and Georgia doubled the number of ports deployed in 2025 in comparison to 2024. In Illinois, this acceleration was driven by Universal, Tesla, bp pulse and Ionna’s heavy expansion in the state, bringing larger than average stations to major metro areas. In Georgia, Tesla alone deployed 300 ports along the I-95, I-75 and I-20 corridors, while Mercedes Benz HPC, Ionna and bp pulse deployed multiple, large stations in similar areas.
States with a smaller number of ports accelerated their deployment in 2025
Beyond the top 10 states, South Carolina (+389% YoY), Mississippi (235% YoY), Maryland (184%) and Colorado (101%) all more than doubled the number of ports deployed in 2025 in comparison to 2024. In all 4 states, Tesla Superchargers accounted for the highest percentage of the statewide growth.
Outside of leading markets, more states are increasing their offerings
The fact that over a third of new ports were deployed outside the top 10 states signals a transition from early-market concentration to nationwide demand normalization.

2025 Port Deployment Outpaced Station Growth
In our Q2 2025 report, we forecasted 16,700 new DC fast-charging ports energized in 2025 based on known deployment plans and historical build patterns. Actual deployments exceeded this estimate as average station size increased faster than expected.
Our 2025 forecast captured deployment momentum but underestimated magnitude
Growth was driven less by station openings and more by a continued shift toward larger stations with more ports per site, particularly in the second half of the year.
Tesla’s deployment pace recovered following a brief slowdown in mid 2024 and remained focused on higher-port locations. At the same time, several non-Tesla networks delivered large-format builds tied to national retail or corridor strategies, adding more ports per location than assumed in mid-year projections.
Taken together, 2025 reinforced a key forecasting insight: station counts alone no longer capture how quickly capacity is scaling. Average station size increased more rapidly than expected, resulting in higher total port additions by year-end.
For 2026, a more measured growth is anticipated
We forecast a more moderate ~8% increase in 2026 to 19,500 new ports as the network matures and deployment velocity naturally slows at larger scale. While the major CPOs are well understood, there remains room for a few surprises.
Two key areas to watch out for are:
- The expansion of Tesla Supercharger for Business deployments, enabling hyper-local rollouts backed by the Tesla platform.
- The ability of new, well-capitalized entrants to replicate large-format charging deployments at a national scale.

NEVI Openings Accelerate, but Remain a Minor Contributor to Total DCFC Buildout
The NEVI program is designed to fund a national network of DC fast charging stations along designated highway corridors. While NEVI station openings increased meaningfully in 2025, the program remains in an early execution phase relative to the broader fast-charging market.
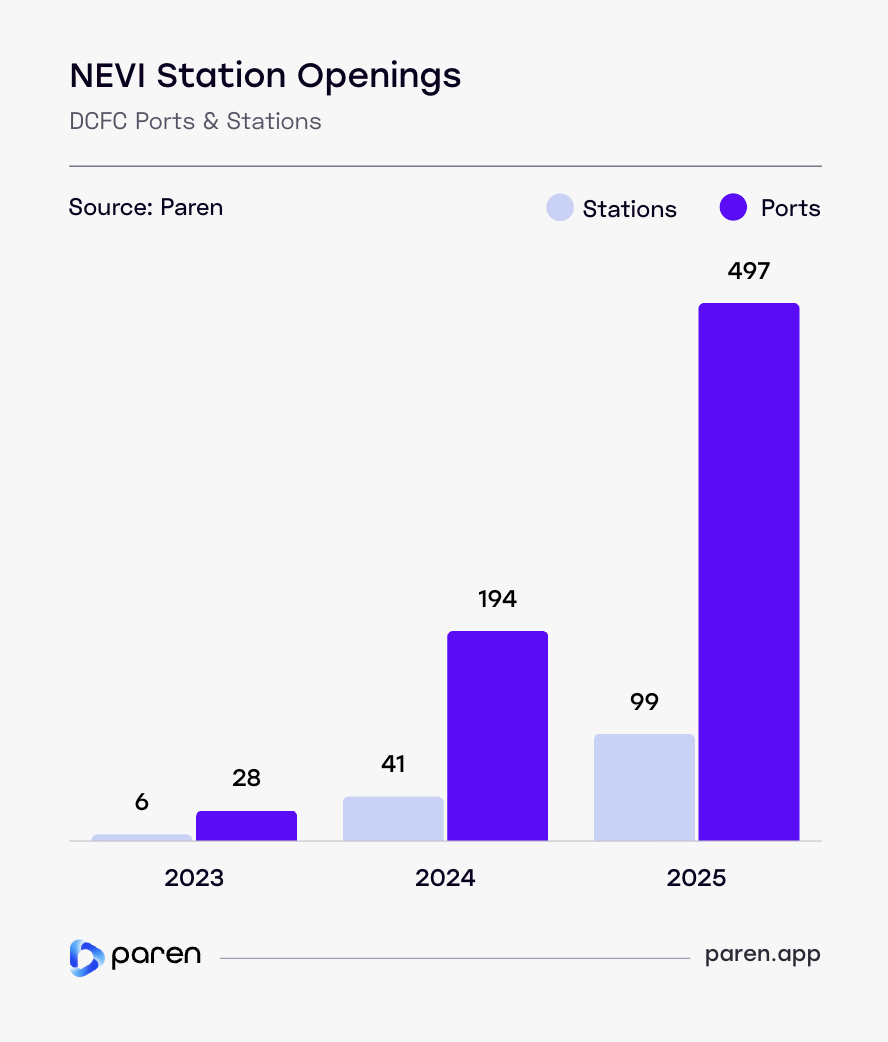
In 2025, 99 NEVI-funded stations and 497 ports came online
This represented more than a doubling of 2024 openings, reflecting growing momentum as states move from awards into construction and commissioning. This marks a clear step forward after a slow initial ramp in 2023 and 2024, driven by procurement complexity, site readiness, and utility interconnection timelines.
Political uncertainty in early 2025 temporarily paused NEVI activity, but deployment resumed in the second half of the year, led by states such as Texas, Colorado, Pennsylvania, and Wisconsin.
Around 3% of new ports deployed in 2025 were NEVI funded
Despite this growth, NEVI-funded infrastructure still represents a small share of total new fast-charging stations and ports deployed nationally in 2025. Most new capacity continues to come from private network expansion, with NEVI contributing incrementally rather than acting as a primary deployment driver.
In 2026, NEVI station openings are expected to grow steadily as California, Massachusetts, North Carolina, and other states move from awards into construction and commissioning.
Utilization & Reliability
Utilization Rate: US Average Remains Unchanged but Fails to Capture the Wide Spectrum of Adoption Level
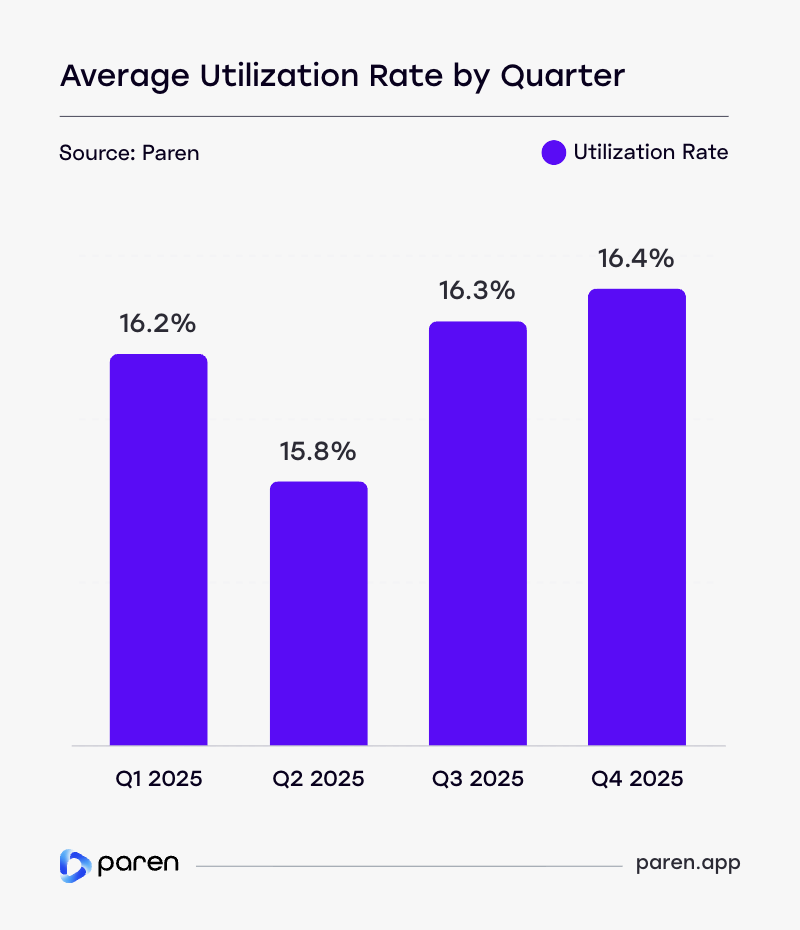
The average fast-charging utilization rate in 2025 remained remarkably stable.
Despite clear seasonal variation, utilization opened the year at 16.2% in Q1 and settled at 16.4% in Q4.
The midyear softness in Q2 reflects a familiar seasonal pattern, as new infrastructure comes online ahead of peak summer travel and utilization temporarily lags added capacity. Utilization recovered in Q3, supported by summer travel and heavier corridor usage, before easing slightly in Q4 as travel normalized and year-end deployments expanded capacity.
A wider spectrum of adoption at the state and MSA level
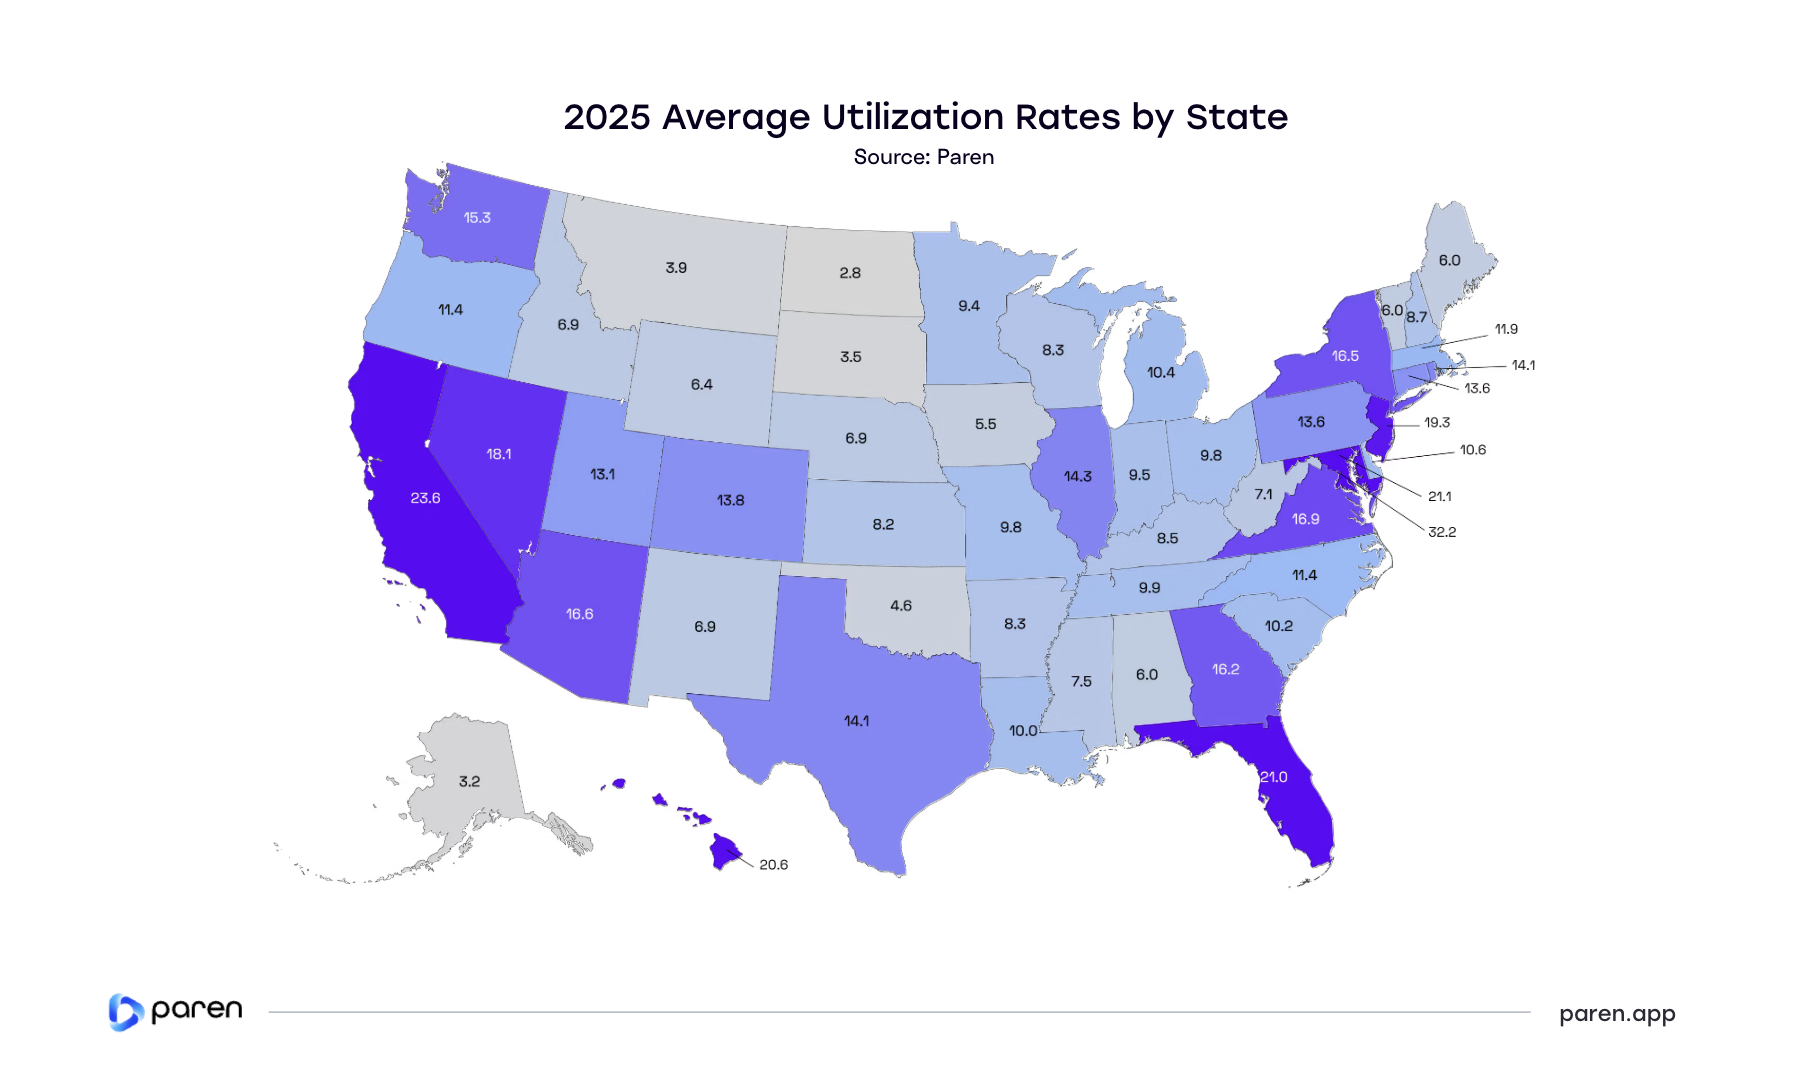
The national utilization rate average does not reflect the diversity of adoption at the regional level. Blending utilization from Washington D.C. (32.2%) and utilization in Alaska (3.2%) is statistically relevant but operationally, not as much.
We will continue to share the national average utilization rate as an indicator of seasonality and broader supply–demand equilibrium but encourage practitioners to review the state and MSA-level rates for a more accurate reflection of the match between infrastructure and usage.
2025 Utilization Rates by State
High-adoption states maintained stable utilization despite rapid expansion
Fast-charging utilization remained highest in coastal, urban, and travel-heavy states. California, New York, Florida, Texas, and Georgia absorbed a disproportionate share of new capacity in 2025 while maintaining relatively stable year-over-year utilization.
Sunbelt states closed the gap
Utilization rose fastest across several Sunbelt states, including Georgia, Arizona, and Texas, as public fast-charging demand outpaced new port additions during parts of 2025, lifting average utilization across maturing networks.
Lower-density regions remain underutilized
Much of the Plains and Mountain West continued to operate at lower—but increasingly stable—utilization levels, reflecting early corridor buildout ahead of near-term demand.
A national normalization is emerging
Utilization is no longer driven by a handful of coastal markets. Many states have settled into a consistent 8–14% range, signaling a more balanced national charging footprint as corridor coverage improves.
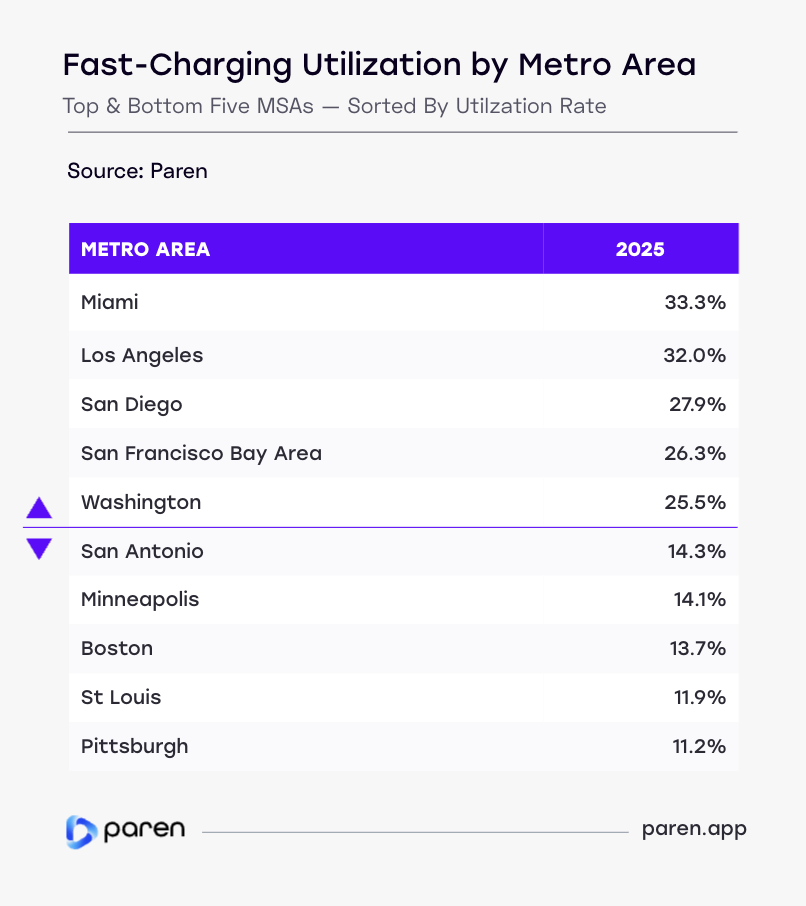
EV Fast-Charging Adoption Is Strong Across U.S. Metros, With a Few Markets Approaching Capacity
Fast-charging utilization in 2025 remained concentrated in large, dense metro areas with strong EV adoption and sustained travel demand. Coastal and corridor-heavy markets—including Miami, Los Angeles, San Diego, the San Francisco Bay Area, and Washington, DC—consistently posted utilization above 25%.
Large Metro Areas in California top the leaderboard
Los Angeles, San Diego and the San Francisco Bay Area are dealing with a sustained demand. Although average utilization appears high, it understates the intensity of peak-hour demand, when congestion at many California sites leads to wait times, charging limits, and constrained driver throughput. Despite the net addition of 3,798 DCFC ports (36% increased YoY) in California, the market remains supply constrained, creating a favorable outlook for continued new DCFC expansion.
Most major metros have normalized
Beyond the top tier, most large MSAs clustered in the low-to-mid teens. These markets have largely moved past early adoption but have not yet reached the demand intensity seen in leading coastal hubs.
A maturing metro-level landscape
While a small group of high-density metros continues to anchor national charging demand, many urban areas are settling into steadier utilization as infrastructure expansion increasingly runs ahead of near-term demand growth.
Public DCFC Infrastructure Scaled to Absorb a 30% Increase in Session Volume
141M DCFC Sessions in 2025
To assess whether this growth translated into higher network strain, we examine both total session volume and average sessions per port over time.
Market equilibrium is between 200-220 SPP per month
At the national level, we believe that supply meets demand when the Sessions per port per month hover between 200 and 220. When SPP is too low, such as in February, Charge Point Operators may not sufficiently leverage their investment. When the SPP is too high, such as during July and August, drivers may experience wait times at peak.
Capacity Expansion Matched Demand Growth
Of the 18,041 ports deployed throughout 2025, the record Q4 deployment of 5,769 ports satisfied the record session volume during the December holidays. This is seen in the SPP for December just below 220 putting the metric within the equilibrium sweet spot.

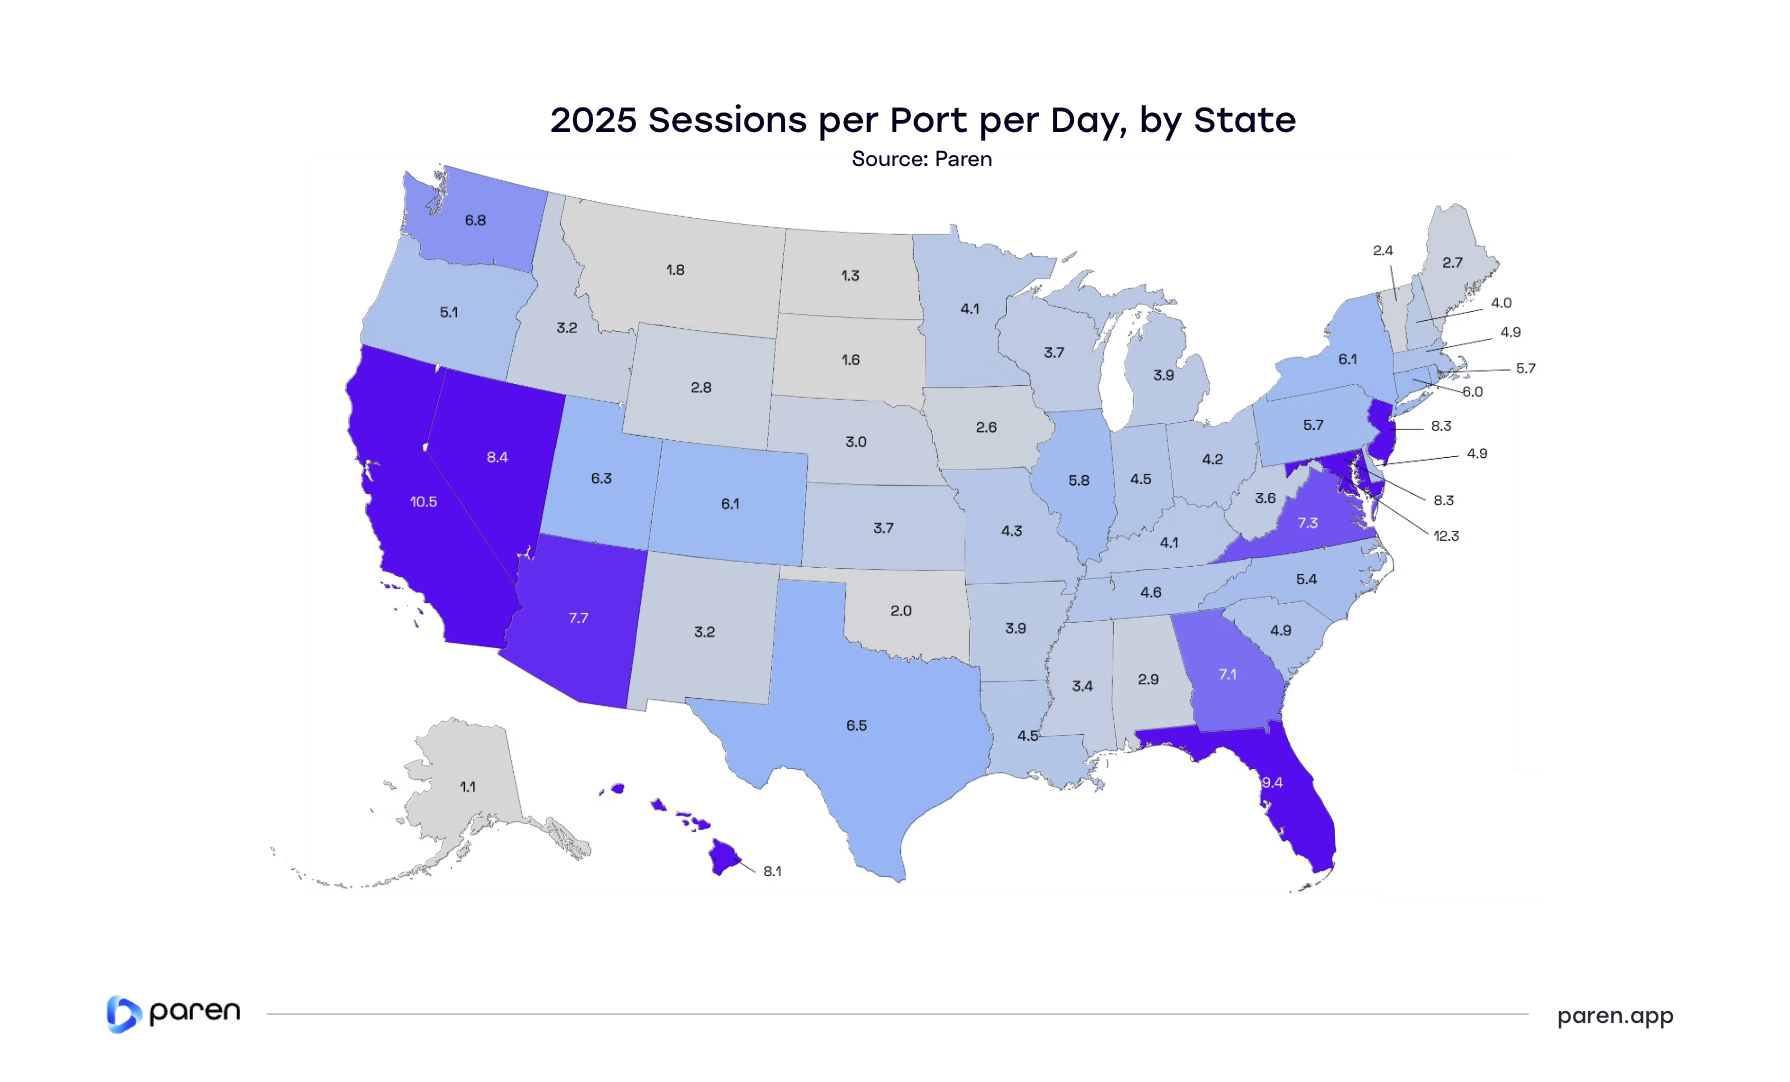
Sessions per Port per Day
Sessions per port per day (SPPD) reflect how frequently individual fast-charging ports are used. This metric varied substantially across the U.S. in 2025, highlighting meaningful differences in network load, site density, and local charging behavior.
High-demand markets clustered along the coasts and in dense travel corridors
The District of Columbia (12.3 SPPD) ranked highest nationally, followed by California (10.5) and Florida (9.4). Other elevated states included Nevada (8.4), New Jersey (8.3), Maryland (8.3), Hawaii (8.1), and Arizona (7.7)—all regions with either high EV adoption, constrained site availability, or strong travel-driven demand.
At the opposite end of the spectrum
Several Plains and Mountain West states saw much lighter usage per port. Alaska (1.1), North Dakota (1.3), South Dakota (1.6), Montana (1.8), and Oklahoma (2.0) recorded the lowest session intensity, reflecting lower traffic volumes and, in some cases, newer or more sparsely distributed infrastructure.
While capacity has expanded nationally, utilization pressure remains uneven
Sessions per port per day was high in dense and travel-heavy markets, and more moderate elsewhere. Taken together, the 2025 data underscores that national buildout has not translated into uniform demand at the port level. Instead, sessions per port remain highly localized.
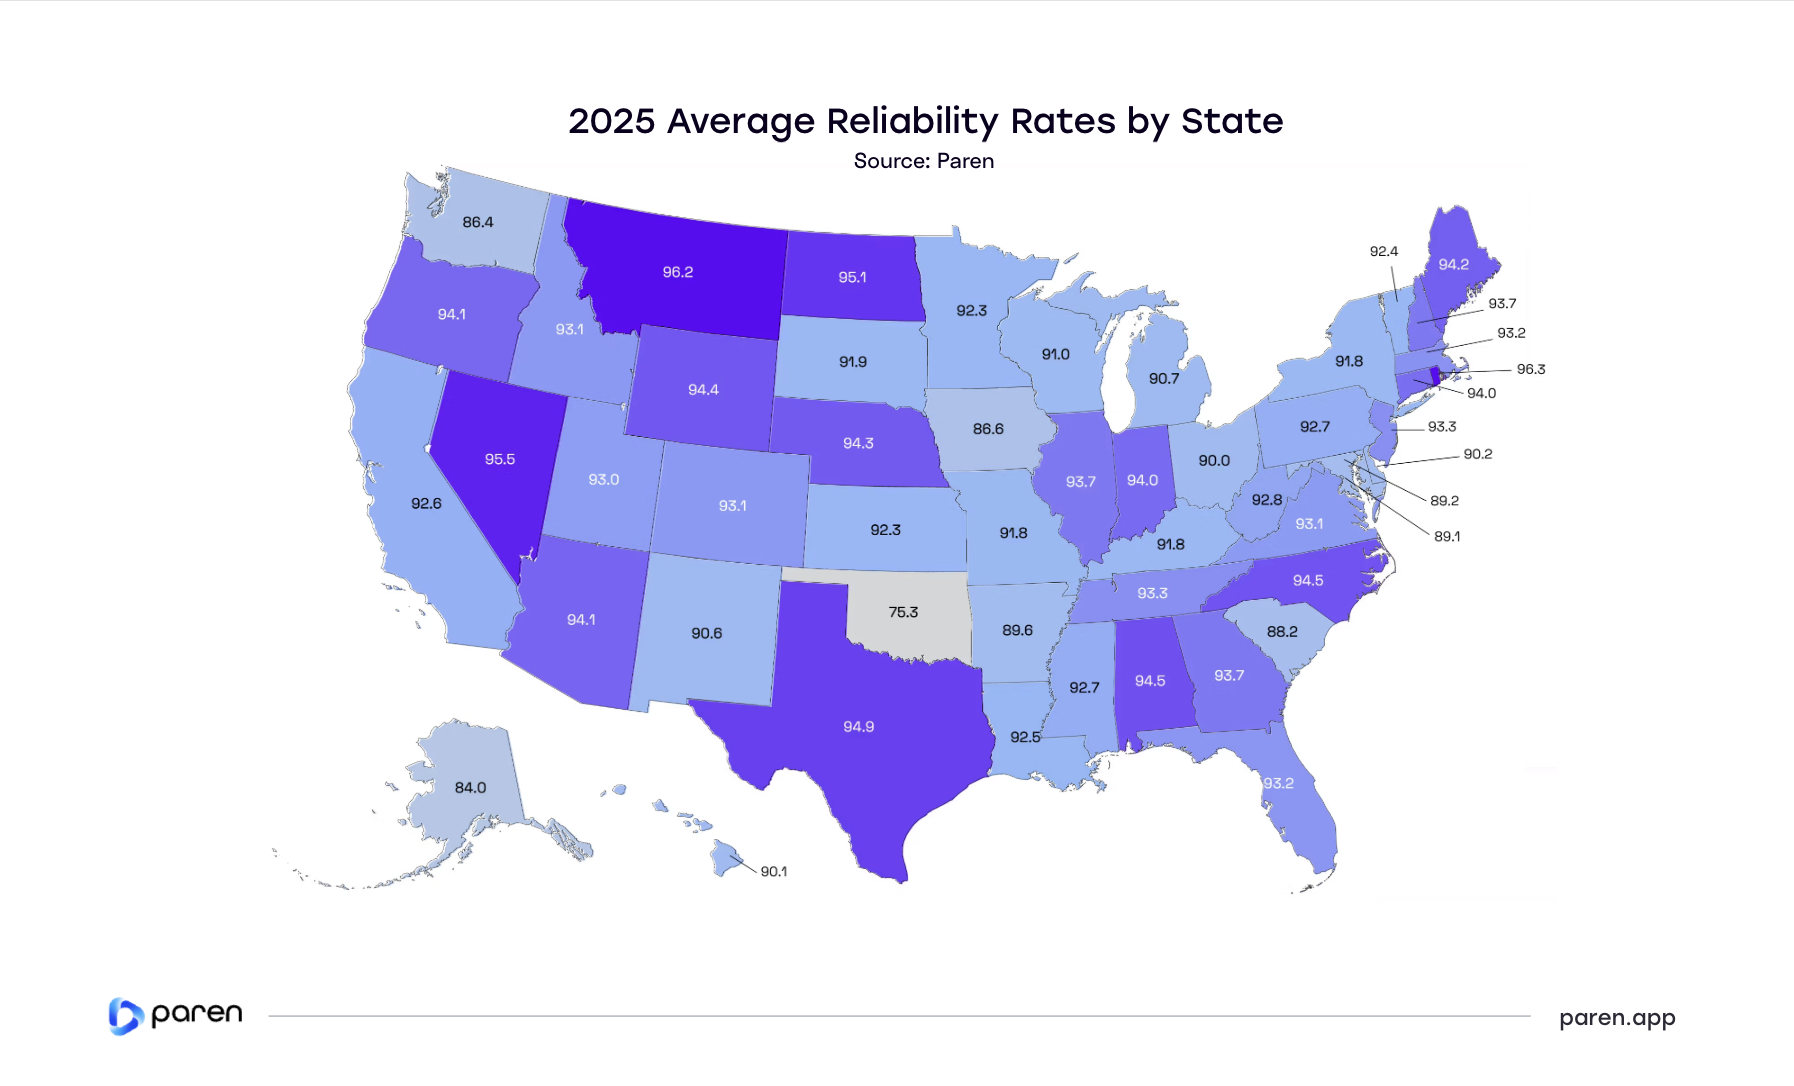
Port Reliability Approaches Operational Maturity
The Paren-specific calculation tracks charger reliability by taking into account recent successful charge sessions with and without retries, failed charge attempts, and station downtime over a specific time period. Overall, we assessed over 95% of all DCFC charging sessions giving us unique perspectives.
Reliability has improved nationwide in 2025
Several large and mature markets led the country with the vast majority of states clustered tightly around the low-90 range. More than half of the state’s Reliability score is between 90 and 94, indicating increasingly consistent performance as networks scale and maintenance practices reach a higher level of maturity.
Hardware refresh cycles and new builds improved reliability
Reliability gains in 2025 were driven by sustained reinvestment in both hardware and operations by leading national operators. Underperforming legacy equipment was progressively replaced, while 18K newly deployed ports entered service with materially higher baseline reliability. Together, hardware refresh cycles, improved new-build standards, and more mature maintenance practices lifted charging success rates across most markets.
EV Charging Pricing
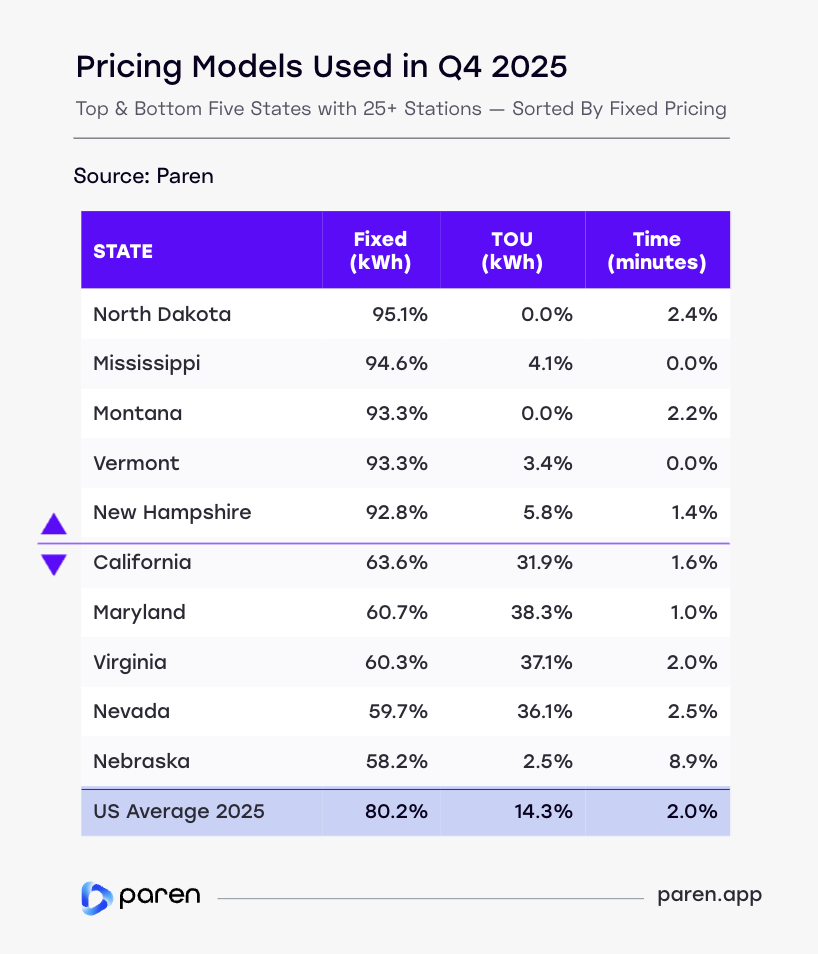
Fixed Pricing Remains the Standard in Q4 2025
Paren’s pricing data summaries start in Q2 2025. This analysis focuses on how price availability shifted from Q2 through Q4 2025.
Fixed per-kWh pricing continued to dominate public DC fast charging in Q4 2025, accounting for just over 80% of pricing models nationally. This pattern held across both high- and low-utilization markets, reinforcing fixed pricing as the operational baseline as networks scale.
Pricing complexity increases with market scale and utilization
Larger, more complex markets—including California and Maryland—showed higher adoption of time-of-use (TOU) pricing. These markets typically face higher utilization, congestion management needs, and greater grid coordination, making limited pricing differentiation operationally relevant. We are also carefully monitoring the rollout of dynamic pricing (a special case of TOU in our data).
Lower-utilization markets favor simplicity
Many lower-density and lower-utilization states relied almost entirely on fixed pricing, with little TOU adoption. This suggests that in emerging or lower-traffic markets, operators prioritize pricing simplicity, predictability, and ease of execution over dynamic optimization.
Time-based pricing remains a secondary model
Time-based (per-minute) pricing remained marginal nationwide in Q4 2025. While pricing strategies are beginning to diversify in select markets, fixed per-kWh pricing continues to anchor the public fast-charging market as operators focus on scale, uptime, and cost transparency.
Average Prices per kWh Remained Largely Stable in 2025
Average prices per state are stable. Mostly.
Average fast-charging prices in 2025 clustered tightly across most of the U.S., with the majority of states falling between $0.45 and $0.53 per kWh. Despite localized variation, state-level average pricing remained broadly stable throughout the year.
Supply constrained states are seeing higher prices
After Hawaii ($0.86/kWh) , New Jersey ($0.63/kWh) is now second on the list of most expensive states to charge an EV likely due to increased demand from high-load sectors like AI data centers.
Time of Use (TOU) pricing is more widely adopted
While average prices remain stable, time-of-use (TOU) pricing has introduced substantial intraday price dispersion in select markets. Within a small geographic radius, observed prices can vary by 50% to 100% depending on time of day and operator. This variability is most pronounced in dense urban markets, where pricing flexibility is increasingly used to manage load and utilization.
Inelastic demand. For now.
We observe limited evidence of price sensitivity at current utilization levels, suggesting demand remains largely inelastic. As pricing transparency improves and TOU adoption expands, price responsiveness may become more visible over time.

Metro-Level Pricing Reflects Local Demand and Market Maturity
National averages mask meaningful local variation
At the state level, average fast-charging prices in 2025 clustered tightly, with most states falling between $0.45–$0.53/kWh. That lower band held even as several high-utilization metro areas consistently priced above it, with leading coastal markets reaching into the low-$0.60s/kWh. As with utilization, metro-level outcomes diverged well before differences appeared in state averages.
Pricing is highest where utilization and congestion are greatest
The highest-priced markets were also the most heavily utilized. New York metro, with utilization above 30%, averaged $0.62/kWh, materially above the New York state average ($0.54/kWh). A similar pattern appeared across California: Los Angeles ($0.60/kWh) and the San Francisco Bay Area ($0.58/kWh) priced above the statewide average of $0.57/kWh, reflecting sustained peak demand and congestion in dense travel corridors.
Lower-utilization metros remain closer to state pricing norms
In contrast, lower-utilization metros clustered near or below their respective state averages. In Texas, where the statewide average was $0.51/kWh, metros such as San Antonio ($0.48/kWh) and Austin ($0.46/kWh) priced meaningfully lower, consistent with utilization rates in the low-to-mid teens and less frequent peak-period congestion.
Local demand intensity increasingly determines pricing
Across markets, pricing dispersion is increasingly explained by local utilization intensity rather than broad state-level conditions. As networks mature, operators in high-demand metros are exercising greater pricing flexibility to manage congestion and recover higher operating costs, while lower-intensity markets continue to anchor pricing closer to statewide norms.

Operational Efficiencies Matter More Than Pricing
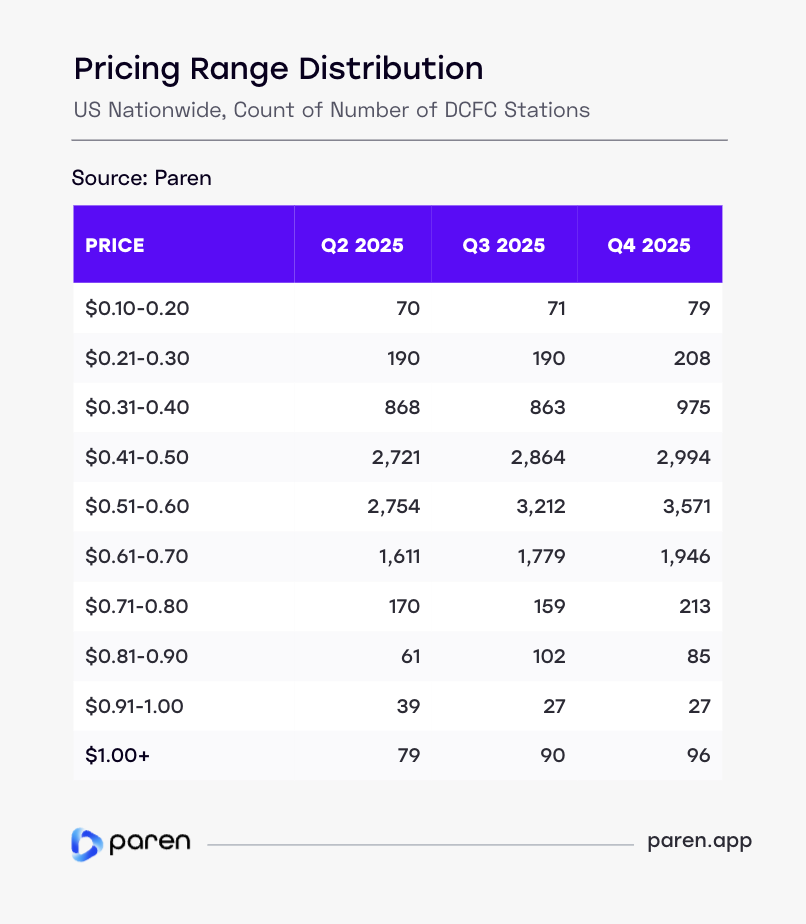
Most stations operate within a narrow pricing band
Across the second half of 2025, public fast-charging prices remained tightly clustered. More than 80% of stations charged between $0.41 and $0.65 per kWh, with the highest concentration in the $0.51–$0.60 range. Among stations added since Q2, roughly 40% entered service within this same mid-band, reinforcing price convergence rather than fragmentation.
Limited pricing dispersion reduces price as a competitive lever
The narrow price distribution suggests the market is not competing aggressively on price. With most stations clustered within a similar pricing band, marginal price differences have limited impact on driver behavior. As a result, operators are focusing less on discounting and more on improving site amenities, performance, reliability, and accessibility to differentiate within constrained price ranges.
Execution—not price—drives utilization differences
When prices are broadly similar, utilization outcomes diverge based on execution. Reliability, power availability, site density, and ease of access play a larger role in shaping demand than marginal price differences. This dynamic is most visible in dense and travel-heavy metros, where stations sustain high utilization even at higher price points.
Pricing pressure is incremental, not disruptive
Overall, the 2025 pricing distribution points to gradual upward pressure within an established structure, rather than a broad reset. As networks scale, performance and availability—not price—are emerging as the primary levers for sustaining utilization and customer preference.
Appendices
Appendix A
Charging Infrastructure
- CPO: Charge Point Operator.
- Fast Charging: Charging port of a minimum of 24 kW.
- NACS: North American Charging Standard; Tesla’s charging connector now adopted by many networks.
- NEVI: National Electric Vehicle Infrastructure program under the Bipartisan Infrastructure Law.
- MSA: Metropolitan Statistical Area.
- Connector: A charging plug conforming to CCS, CHAdeMO, or NACS (J3400) standard.
- Port: A charging unit with one or more connectors capable of charging one or two EVs simultaneously.
- Station: A physical location with one or more EVSEs (charging ports).
Utilization & Reliability
- Reliability Index: The Paren-specific calculation that measures charger reliability taking into account recent successful charge sessions with and without retries, failed charge attempts, and station downtime over a specific time period.
- Tesla: Tesla is a reference to the Tesla Superchargers.
- Utilization: The percentage of tracked time spent on both successful and unsuccessful charging activity at a charger over the time period open per day.
EV Charging Pricing
- Fixed Price: Refers to a consistent rate per kWh for the entire charging day.
- Time of Use (TOU): Pricing changes based on the time of day with higher prices during expected peak demand time. It encourages off-peak charging and can help balance grid demand.
- Dynamic Pricing: Pricing changes based on ad-hoc changes not tied to a specific time. Typically, dynamic pricing daily spreads are within the same minimum and maximum of the TOU model.
- Time: Charges by the minute or hour. Often used where energy-based pricing is restricted.
Methodology Notes
- All data in this report reflects publicly available DCFC stations.
- Pricing section is based on data from combined sources and is presented at the Station level
- Tesla pricing includes both member and non-member pricing models.
- Some of the Q2 data referenced in this report has been revised or updated from our Q1 and Q2 2025 reports due to continued expansion of network coverage and ongoing refinement of how certain metrics are calculated, including our reliability score.
Data Sources
- AFDC+: Paren Infrastructure Dataset
- Select NEVI RFP documents and award data
- Proprietary charging session / utilization models
Appendix B
Metropolitan Statistical Areas
- Atlanta: Atlanta-Sandy Springs-Alpharetta
- Austin: Austin-Round Rock-Georgetown
- Boston: Boston-Cambridge-Newton
- Charlotte: Charlotte-Concord-Gastonia
- Chicago: Chicago-Naperville-Elgin
- Cincinnati: Cincinnati
- Columbus: Columbus
- Dallas: Dallas-Fort Worth-Arlington
- Denver: Denver-Aurora-Lakewood
- Detroit: Detroit-Warren-Dearborn
- Houston: Houston-The Woodlands-Sugar Land
- Kansas City: Kansas City
- Las Vegas: Las Vegas-Henderson-Paradise
- Los Angeles: Los Angeles-Long Beach-Anaheim
- Miami: Miami-Fort Lauderdale-Pompano Beach
- Minneapolis: Minneapolis-St Paul-Bloomington
- New York: New York-Newark-Jersey City
- Orlando: Orlando-Kissimmee-Sanford
- Philadelphia: Philadelphia-Camden-Wilmington
- Phoenix: Phoenix-Mesa-Chandler
- Portland: Portland-Vancouver-Hillsboro
- Sacramento: Sacramento-Roseville-Folsom
- San Antonio: San Antonio-New Braunfels
- San Bernardino: San Bernardino-Riverside-Ontario
- San Diego: San Diego-Chula Vista-Carlsbad
- San Francisco Bay Area: San Francisco-Oakland-Berkeley
- Seattle: Seattle-Tacoma-Bellevue
- St Louis: St Louis
- Tampa: Tampa-St Petersburg-Clearwater
- Washington: Washington-Arlington-Alexandria
About Paren
Paren is a data platform for EV charging insights
As a neutral platform, Paren uniquely aggregates, enriches and standardizes fast charging across North America. We started these quarterly reports to provide EV charging leaders with a richer perspective on the broader industry dynamics using our unique data and insights.
We value your feedback, email us at: hello@paren.app
Paren provides granular insights on EV charging at scale
Paren is a real-time data platform for electric vehicle charging that standardizes reliability, availability, pricing, and amenities across networks. By covering over 95% of the US fast charging infrastructure, we process over 100M real-time events per day over more than 70K DCFC ports in the US and 7K DCFC ports in Canada. Our partners are automakers, charge point operators, map makers, ride share operators and government entities in need of rich and reliable data.
Offering historical data from January 2024 and real-time data
Our platform offers access to historical and real-time data using the following platforms:
Interested in deeper insights?
- Follow Paren on LinkedIn ↗ link
- Check our blog posts ↗ link
- Read about Paren in the news ↗ link
- Track our monthly CPO/Network leaderboard ↗ link
Report Team

Want the data behind the data?
Access utilization, reliability, and pricing at the station level across 95%+ of US and Canadian DCFC infrastructure.