US EV Fast Charging — Q2 2025
Paren’s Q2 2025 EV Charging Report reveals a sharp rebound in new port deployments, continued reliability gains, and rising charger speeds across the U.S. fast charging landscape. Despite Tesla’s declining market share, total infrastructure is expanding at record pace, driven by Charging 2.0 players. The report also tracks utilization shifts, NACS adoption gaps, and evolving pricing strategies as the industry scales for accelerating EV demand.
Q2 2025 saw the continuation of several positive trends in the US DC fast charging (DCFC) industry that are leading to a more predictable and better customer experience for EV drivers. However, there are some warning signs for CPOs, charging networks, and retailers that could portend challenges ahead on the financial side of the equation.
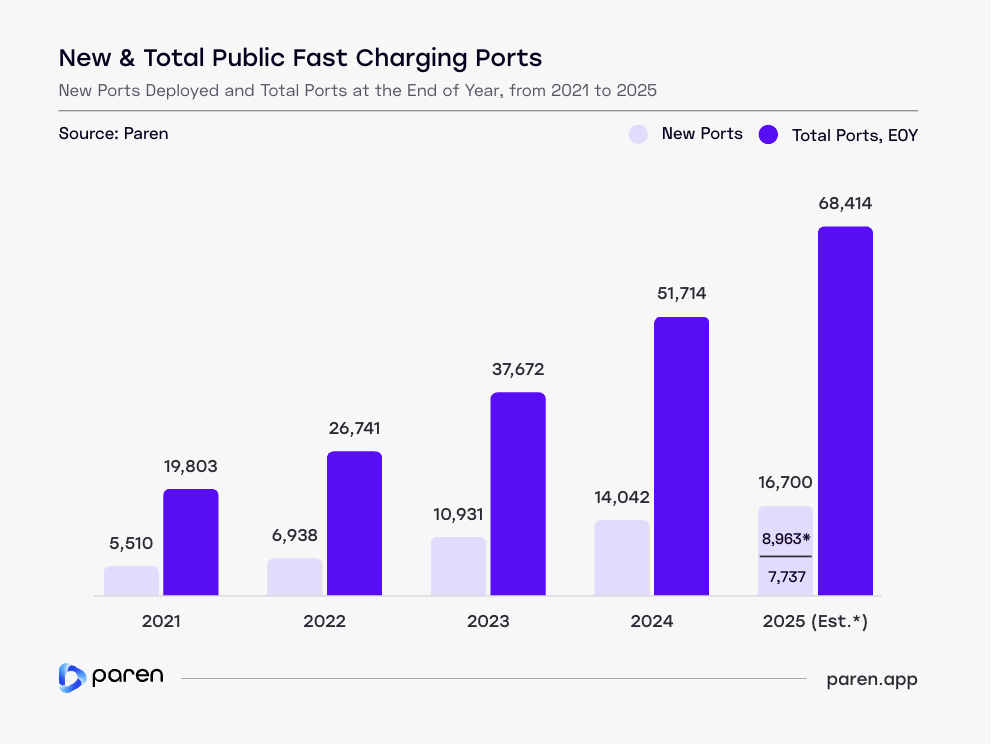
On the positive side, deployment of new fast charging ports and stations is on a record pace in 2025, and we are forecasting 16,700 ports will open in 2025—which would be 2.4 times as many ports opened three years earlier in 2022. At the current rate of growth, the number of US fast charging ports will surpass 100,000 in 2027, nearly four times the number in 2022 and about double the number in 2024.
CPOs are not just deploying more ports and stations, but higher-power chargers and much larger stations that combined provide a better experience for drivers and minimize wait times and frustration. Though the federal National Electric Vehicle Infrastructure (NEVI) program set a minimum requirement of four, 150 kW chargers, the large “Charging 2.0” players are “standardizing” around 10, 350 kW/400 kW chargers helping the overall port to charger ratio rise to an average of 5.4 ports per station in Q2 versus 4.7 in Q1. In Q2 2025, we saw a clear pivot toward higher-capacity infrastructure with total share of 250+ kW chargers rising sharply to 38% from 24% for non-Tesla.
Other findings:
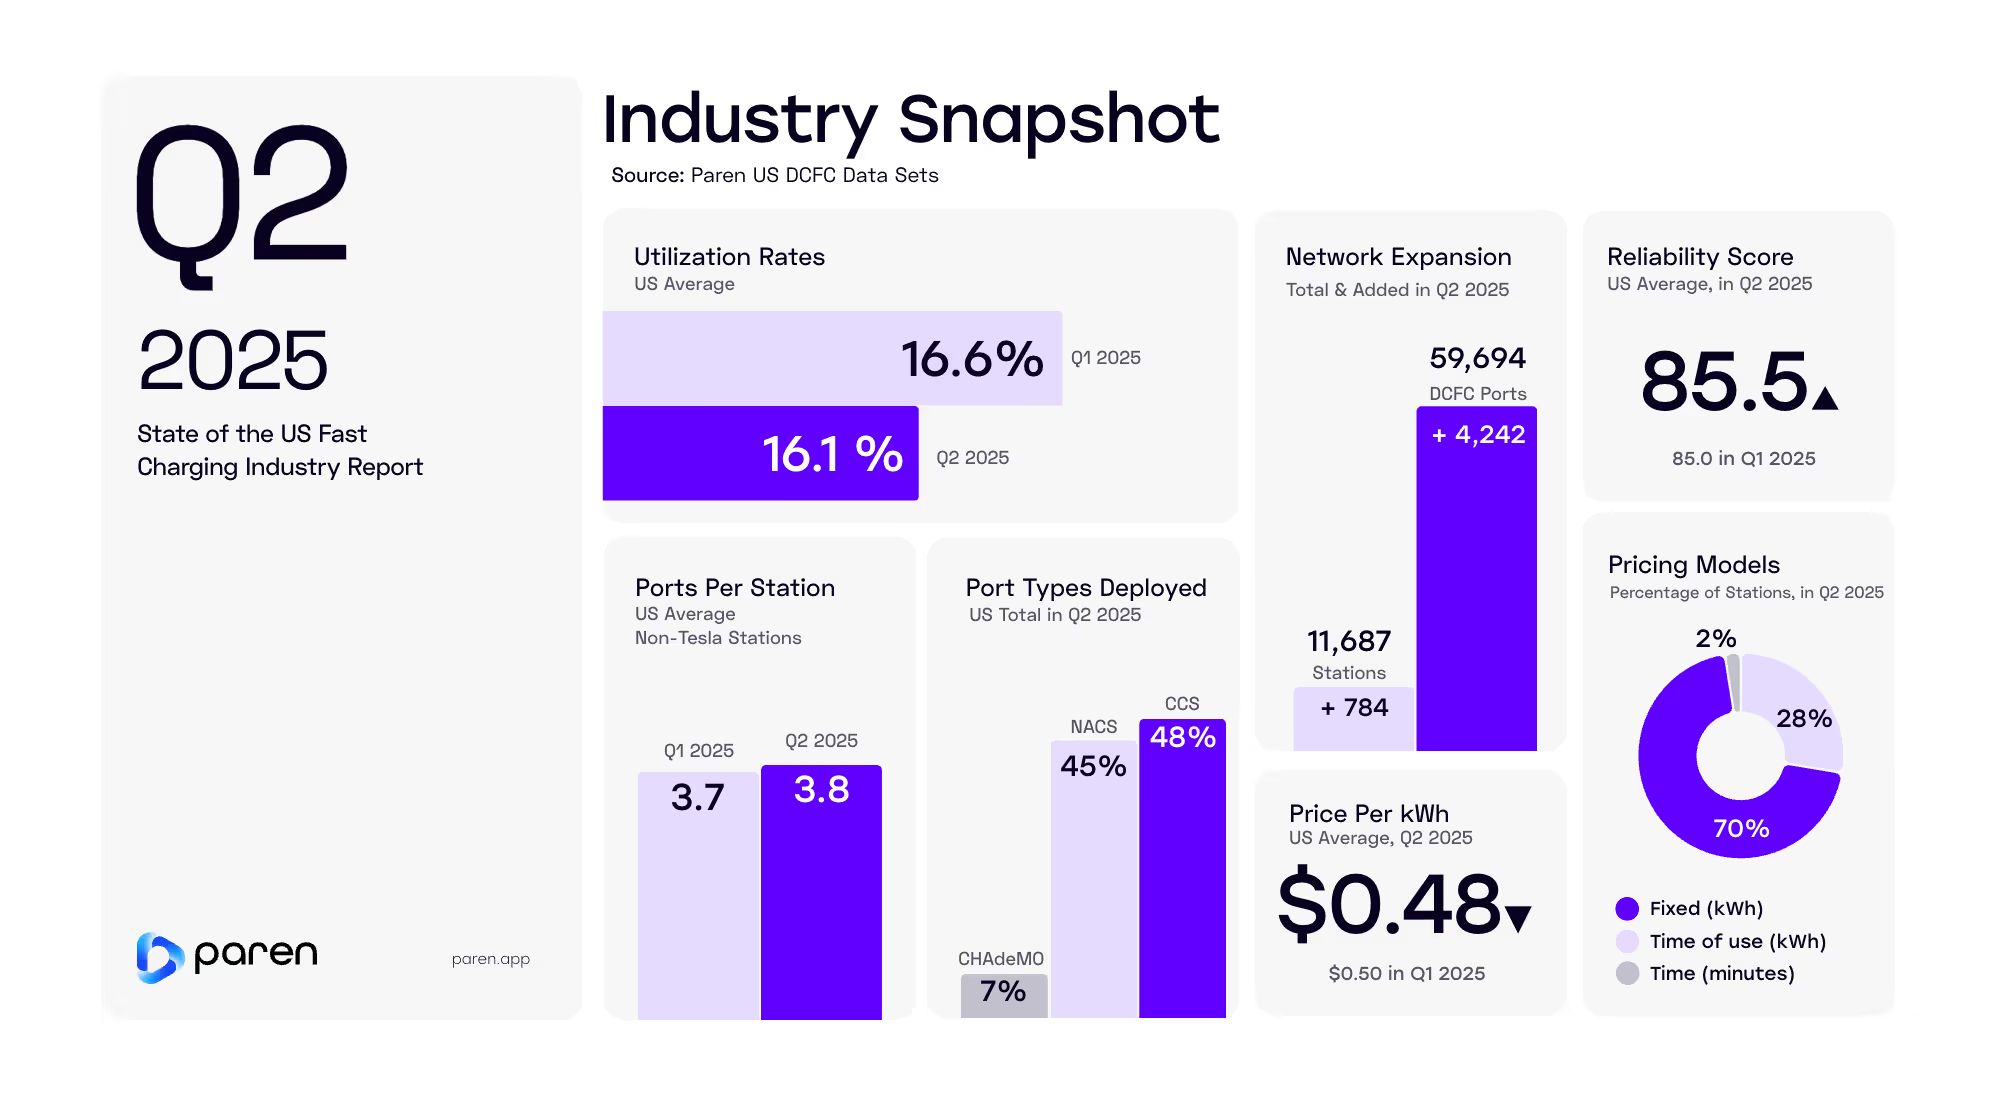
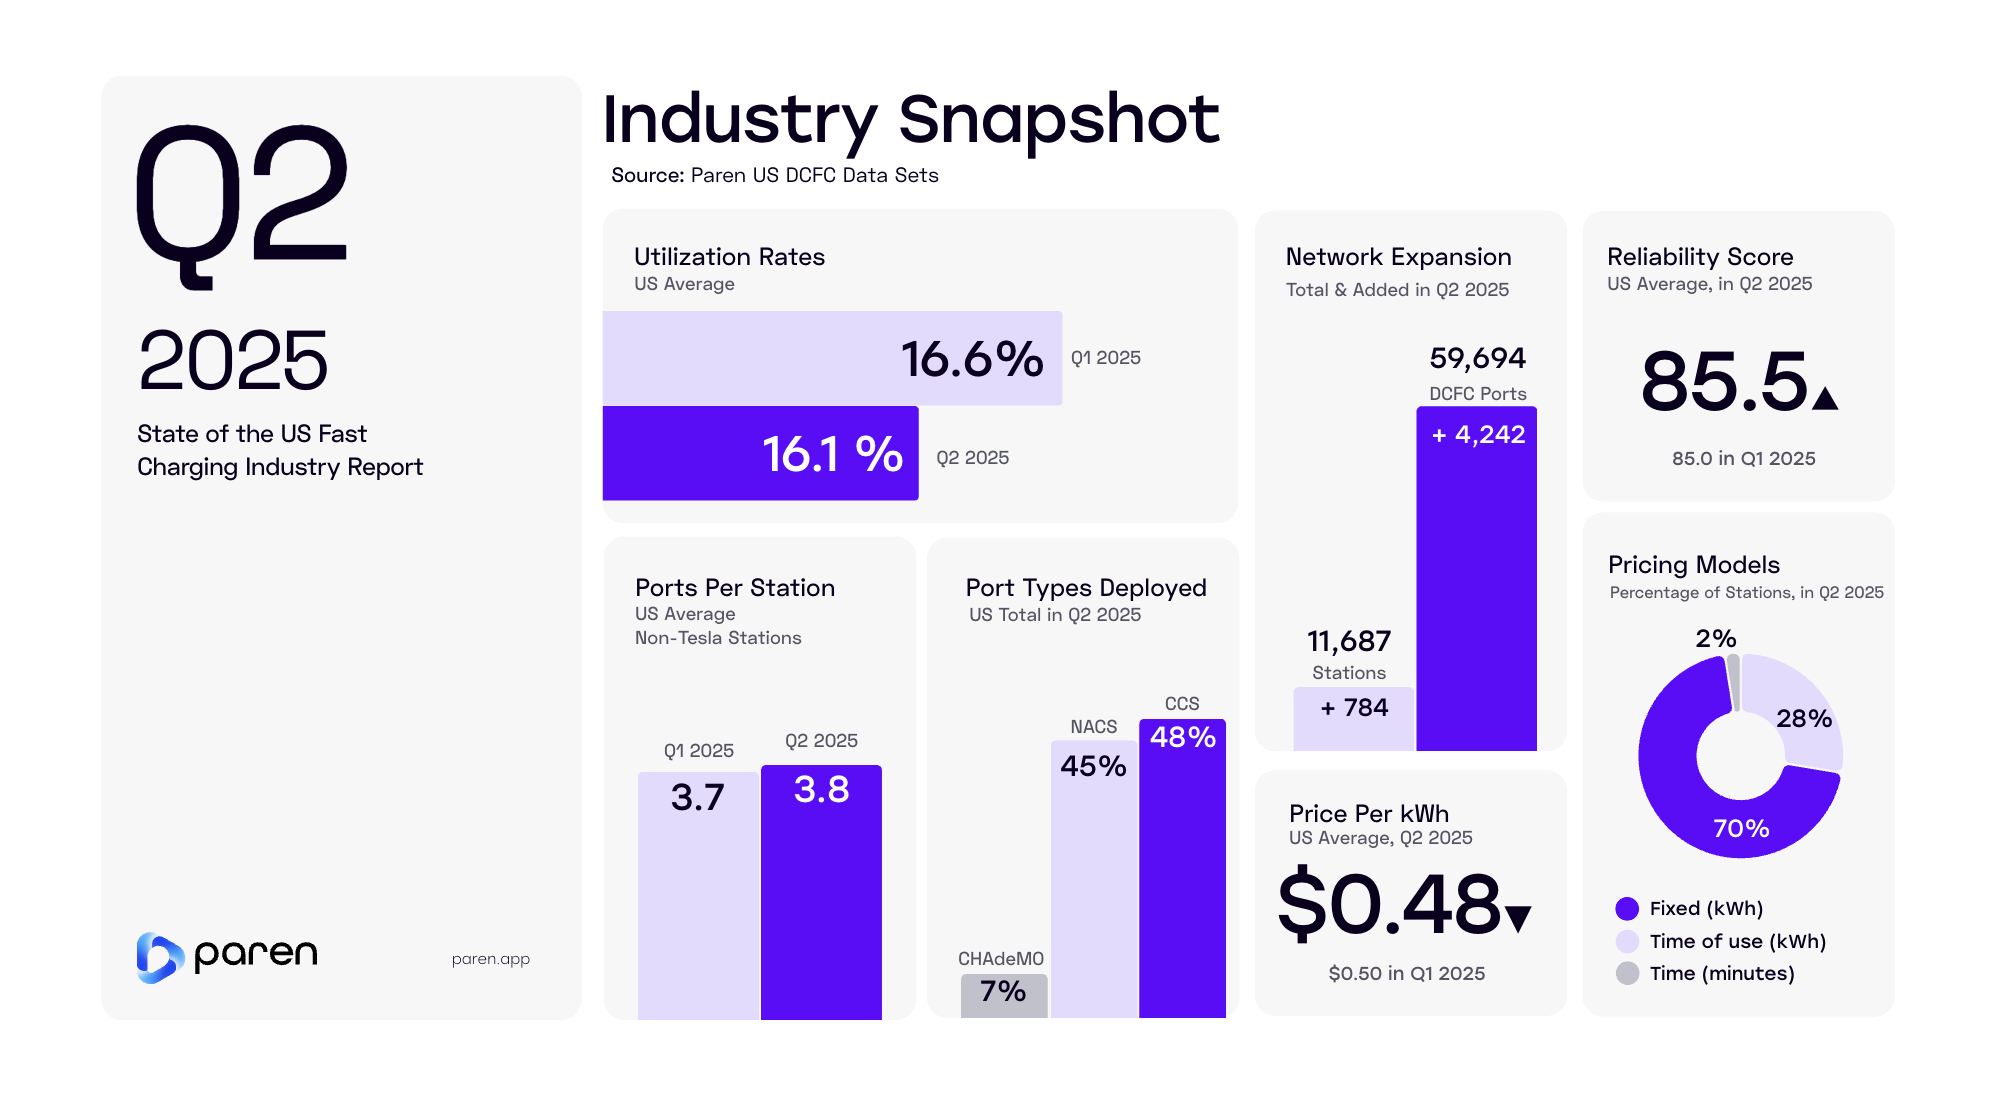
- Average utilization declined to 16.1% from 16.6% resulting from weather, regional, and seasonal differences.
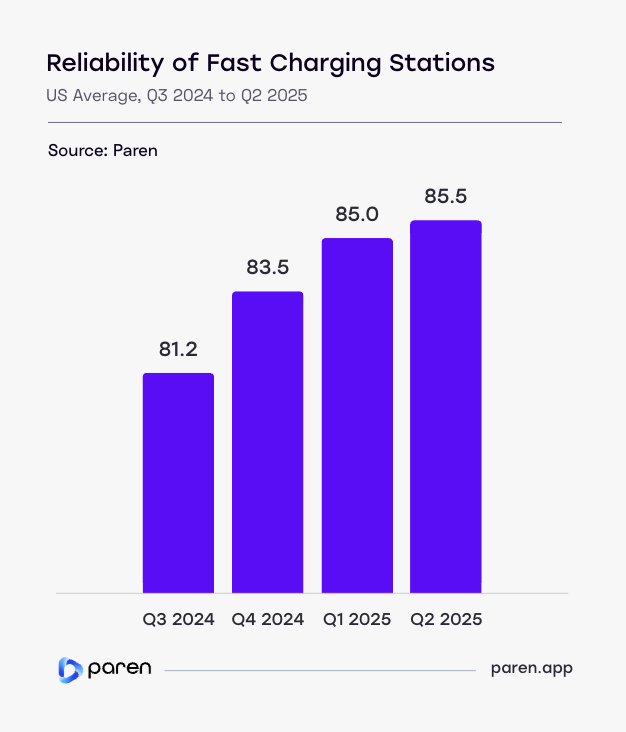
- Reliability rose slightly to 85.5 from 85.0.
- Average prices at travel stations declined in 43 states.
Paren is excited to release this second of an on-going series of quarterly reports on the state of the fast-charging industry in the US This report will continue to grow and evolve with additional data sets and analysis. We hope you find it of great value and welcome feedback and suggestions for improvement or additional types of data, analysis, and segmentation. Please email us at: hello@paren.app
The Paren Team
Note: Some of the Q1 data in this report has been revised or updated from our Q1 2025 report due to continued expansion of network coverage and ongoing refinement of how certain metrics are calculated.
US DC fast charging stations are being deployed at a record pace, increasing in size (more ports) with higher-power chargers, seeing improved reliability, and more predictable pricing — great news for EV drivers! However, in Q2 we saw declines in utilization at many stations, a result of factors including weather, seasonality, and deployment outpacing session demand.” — The Paren Team
Charging Infrastructure Expansion
Newly-Opened Ports Increase 23% in Q2 2025
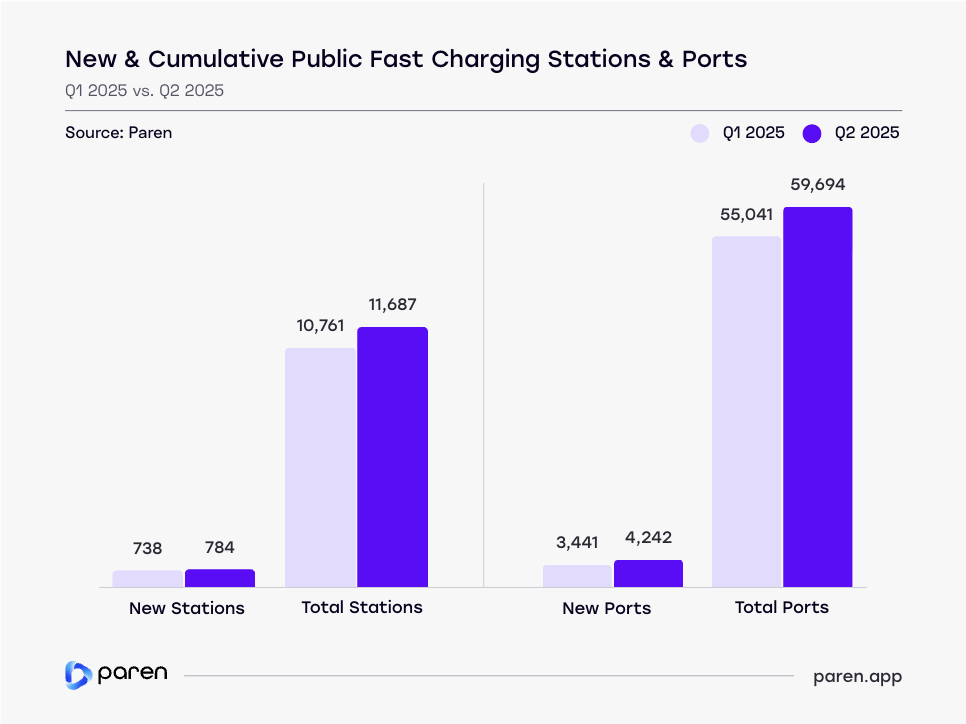
The US fast charging network expanded further in Q2 2025, reaching a total of 11,687 stations and 59,694 ports.
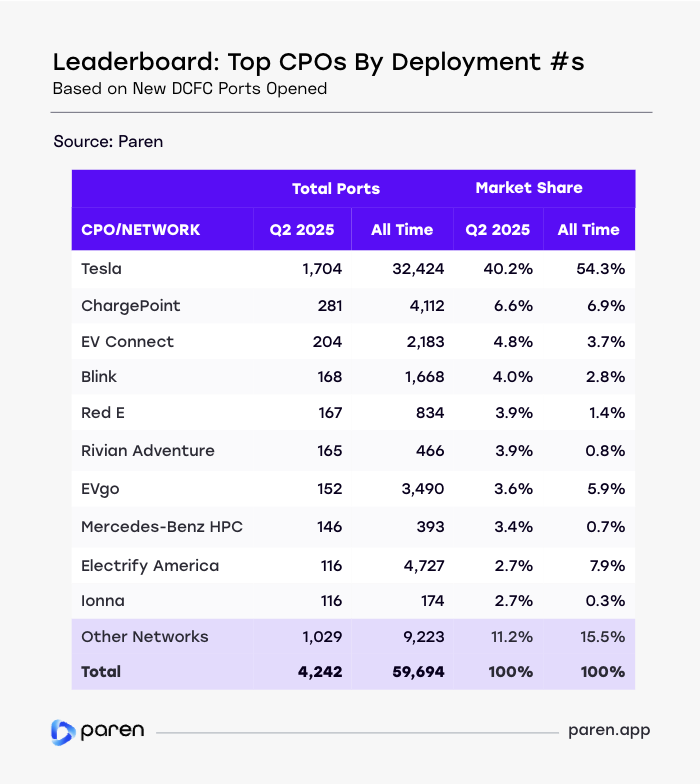
After a seasonal dip in Q1, the number of newly opened ports rose to 4,242, a 23.3% increase over the previous quarter. This QoQ growth was driven primarily by significant QoQ increases from Tesla, ChargePoint, and EVgo. Further, 26 or 50% of the CPOs with new ports opened in Q2 opened more ports in the quarter than in Q1 2025.
Major CPOs are opening new or expanding existing stations typically at 8, 10, 12 or more ports.
New station openings also ticked up slightly (6.2%) to 784, up from 738. While not a dramatic spike, these gains signal a return to growth after a slower winter quarter. The much larger increase in ports versus stations is due to major CPOs opening new or expanding existing stations typically at 8, 10, 12 or more ports.
Q2’s performance also aligns with typical seasonal patterns, where warmer weather and broader construction windows support infrastructure buildout. As more NEVI-funded sites move from planning to execution, we expect deployment numbers to remain strong heading into the second half of the year.
Fast Charging Ports Forecasted to Increase 19% YoY
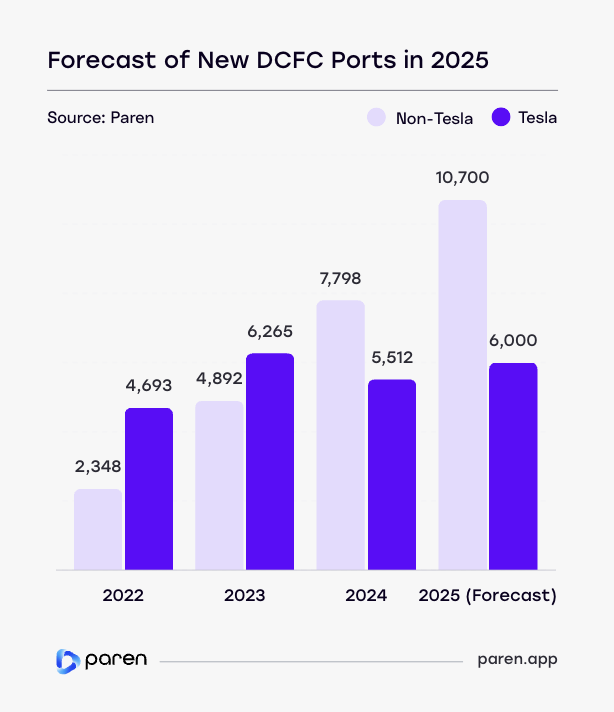
We are forecasting that 16,700 new fast charging ports will open in 2025 by CPOs/charging networks. This is a YoY increase of 19%—a powerful message countering the narrative that deployment of charging stations has slowed or declined in the US.
The Federal Highway Administration's (FHWA) pause of the NEVI program has captured the majority of charging industry news headlines in 2025, however, behind the scenes, charge-point operators are moving full-steam ahead with aggressive deployment plans. Even before the pause, the NEVI program and funding would have only accounted for perhaps 2-3% of the total number of new DCFC ports opened in 2025.
In 2024, non-Tesla networks deployed more DCFC ports than Tesla for the first time.
There are several factors driving the strong growth in 2025, despite multiple regulatory, incentive, and market headwinds. These include:
- After layoffs of the Tesla Supercharger team in April 2024, there was a significant slowdown for a few months, but since the fall of 2024, Tesla's deployment has been back on pace.
- Several large "Charging 2.0" companies have entered the fast charging space in 2024 or 2025 in a big way, including IONNA, Mercedes-Benz HPC, Walmart, and bp pulse.
- Several companies that were already operating charging stations prior to 2025 have started to significantly increase deployments, including Blink, ChargeLab, Electrify America, EvGateway, Love's, Pilot Flying J, Red E Charging, Revel, Rivian, and others.
- In 2024, four CPOs opened 400 or more new ports, whereas 12 CPOs are likely to open 400 or more new ports in 2025.
- In 2025, we expect 63 CPOs to open 4 or more DCFC ports in the US, versus 50 in 2024.
- Between 2024 and 2025, roughly 2.5 million new fully-electric vehicles will be purchased, significantly growing the demand for charging. Additionally, rideshare drivers are adopting EVs at a fast-growing rate, driving an outsized growth in charging sessions and resulting in CPO plans to expand existing stations and add new ones — especially in key markets.
New DCFC Ports Added in 2025 Will Be 3 Times the Number Added in 2021
Based on our estimate for the full-year 2025, total DCFC ports will have increased 245% since 2021 with an increase of 48,611 ports.
Our forecast of 16,700 ports opened in 2025 would be 3 times as many ports opened four years earlier in 2021. At the current rate of growth, the number of US fast charging ports will surpass 100,000 in 2027, roughly four times the number in 2022 and about double the number in 2024.
Despite the headlines around EV and EV charging headwinds, CPOs are now building fast charging infrastructure at an unprecedented rate. In its 2023 forecast out to 2030, NREL estimated that the US would need a total of 182,000 DC fast charging ports to support 33 million EVs. At the continuing rate of growth of new ports, CPOs may in fact reach that target—but US consumers may not hold up their end of the bargain in buying 33 million EVs.
While there have been numerous articles about the need for more charging infrastructure in the US, the real issue is not just "more" but siting stations to both fill charging deserts in rural areas and reduce congestion in the busiest urban markets. Private industry will solve the latter issue, but programs such as the Federal NEVI funding are key to building out charging stations in areas without chargers but may have very low utilization.
Trend of Larger Charging Stations Continues
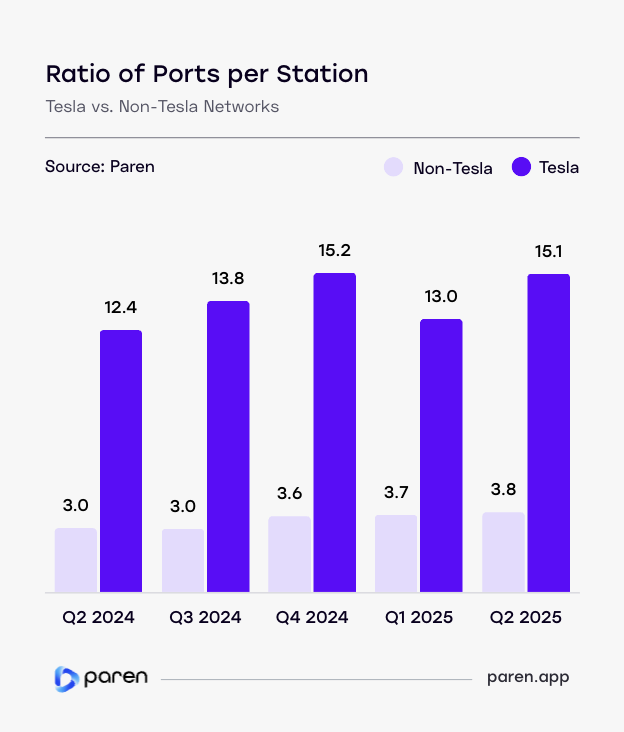
In Q2 2025, the average number of ports per station rose for Tesla and non-Tesla networks, continuing the trend toward larger, higher-capacity installations across the US. Overall, the per port ratio rose to an average of 5.4 ports per station in Q2 versus 4.7 in Q1.
Tesla’s ports per station climbed back to 15.1, just shy of its Q4 2024 peak of 15.2, which was driven by a few 50-100+ port stations. This rebound suggests a renewed push for larger Supercharger sites after a dip in Q1. The company’s strategy remains centered on high-density, high-throughput locations—especially along major travel corridors and in urban hubs.
Non-Tesla networks ticked up slightly to 3.8 ports per station, a small but meaningful increase from 3.0 in Q2/Q3 2024. The year-over-year growth of 27% reflects the sector’s response to growing utilization and pressure to improve driver experience through increased station capacity.
New CPOs such as IONNA, Mercedes-Benz HPC, Walmart, and bp pulse—along with Electrify America—will average at or close to 10 ports at their new stations.
Despite this progress, Tesla still operates nearly 4 times as many ports per station as non-Tesla providers—a ratio that widened slightly from Q1. However, the gap remains narrower than in 2024, when Tesla averaged 4.6 to 4.7 times more ports per station.
The increasing size of both Tesla and non-Tesla sites signals a shift in network design, as Charge Point Operators respond to rising EV adoption, rideshare driver usage, and the economics of deploying fewer but larger hubs. We expect the non-Tesla network ratio to reach 4.0 later this year as major new CPOs such as IONNA, Mercedes-Benz HPC, Walmart, and bp pulse—along with Electrify America—will average at or close to 10 ports at their new stations.
One factor that kept the ratio below 4.0, is that ChargePoint (2.1) and Blink (2.9) accounted for 10.5% of new ports in Q2, but average 2.1 and 3.2 respectively. On the positive side, 27 CPOs/networks averaged 4.0 or higher and accounted for 71% of new ports. Those 27 CPOs had a combined average of 6.7 ports per station.
Tesla Remains Dominant in DCFC Deployment — But Its Overall Share Continues to Decline
Except for its first year of operation in 2012, Tesla has dominated the US public fast charging market based on new DC fast charging ports opened each year. Between 2013 and 2017, Tesla accounted for 85% to 98% of new ports opened. Beginning in 2018, however, when major networks/CPOs such as EVgo and Electrify America entered the market, Tesla's share began to decline and ranged between 53% to 78%. In 2024, Tesla's share of new ports deployed for the first time dropped below 50%, to 41% and in Q2 2025 it dropped further to 40%. (see table)
We are forecasting Tesla opening 6,000 ports in 2025, which would be a further share drop to 36%.
But share of ports deployed can be misleading, as while Tesla's share declined in several recent years, the number of ports deployed increased each year to peak at 6,265 in 2023. We are forecasting Tesla opening 6,000 ports in 2025, which would be a further share drop to 36%.
The driver of Tesla's shrinking share while deploying a growing or flat number of new ports opened each year is of course due to both the breadth of the number of CPOs and their scale of deployments. In 2018, there were eight CPOs that opened 10 or more ports, and only three at 100+. Contrast that with 2024, where 38 CPOs opened 10 or more ports, and 18 at 100+ ports.
In 2025, we are starting to see "Charging 2.0" players including Rivian, Mercedes-Benz HPC, Walmart, bp pulse, and others significantly scale up. These large retailers, automakers, and fuel & convenience-store operators whose primary business is NOT charging, are just now starting to scale up, and many have plans to open thousands of stations in North America by 2030. While it will take several years for some of these new players to capture a significant overall market share—we expect the 2026 leaderboard to be dominated by these new/recent market entrants.
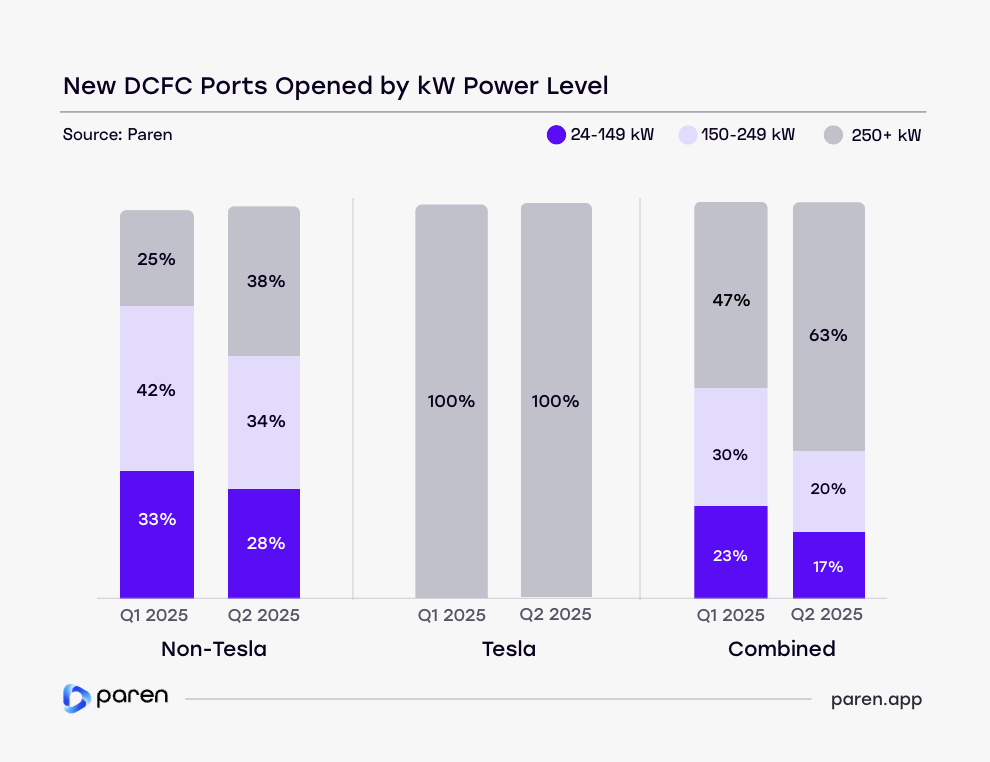
63% of Chargers Deployed in Q2 2025 Were 250 kW+
After a brief uptick in lower-power deployments earlier this year, Q2 2025 saw a clear pivot toward higher-capacity infrastructure—especially among non-Tesla networks. The share of 250+ kW chargers rose sharply from 25% to 38%, while 24–149 kW units fell from 33% to 28%, and 150–249 kW ports dropped from 42% to 34%.
Though federal NEVI standards required a minimum power of 150 kW (minimum power when charging two EVs from a single charger), most of the larger (and fast-growing) CPOs are now deploying chargers with power levels of 350 kW or 400 kW.
The fast-charging market is rapidly consolidating around high-output hardware that supports speed, scalability, and future demand.
Tesla remained consistent, deploying 100% 250+ kW chargers, while non-Tesla networks drove the industry-wide trend. Overall, 63% of all new ports in Q2 were ultra-fast (250+ kW)—up from 47% in Q1—while lower-power ports dropped to just 17%.
While low-power chargers are ideal for long-dwell use cases, Q2 made it clear: the fast-charging market is rapidly consolidating around high-output hardware that supports speed, scalability, and future demand.
Non-Tesla Charging Networks Slow to Adopt NACS Connectors With Less Than 1,000 to Date
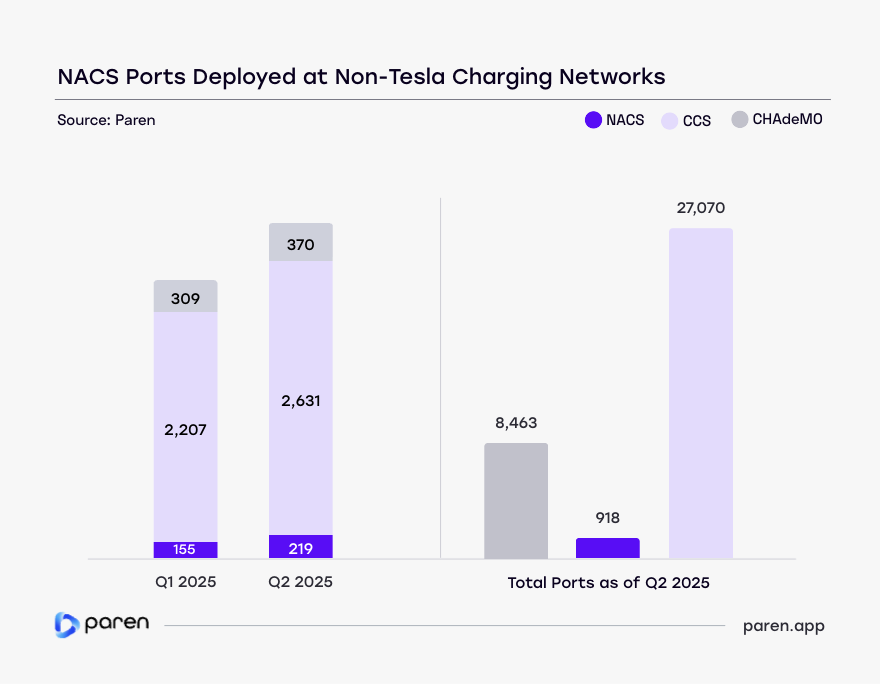
As the transition to the North American Charging Standard (NACS)* advances, Tesla remains far ahead in making its Superchargers accessible to non-Tesla EVs. In Q2 2025, 89% of all publicly available NACS ports were at Tesla sites, compared to just 6.8% on non-Tesla networks.
As of Q2’s end, non-Tesla charging networks have only installed 918 NACS cable connectors that would make it easier to charge non-Tesla vehicles capable of charging via a NACS connector. And the rate of growth at non-Tesla networks remains at a snail's pace with 219 NACS ports deployed, roughly 65 more than the 155 deployed in Q1.
As of Q2’s end, non-Tesla charging networks have only installed 918 NACS cable connectors.
Despite growing industry momentum and commitments from automakers and charging providers, non-Tesla networks have been slow to deploy NACS hardware. This disparity suggests that most non-Tesla charging providers are still in the early stages of rollout—either testing limited deployments, waiting for upgraded hardware, replacement of older cables and connectors, or delaying until many more new EV models come with the NACS port.
*The official name of the port standard is now J3400.
Utilization & Reliability
Utilization Declines in 70% of States — But Rises in Many Rural States
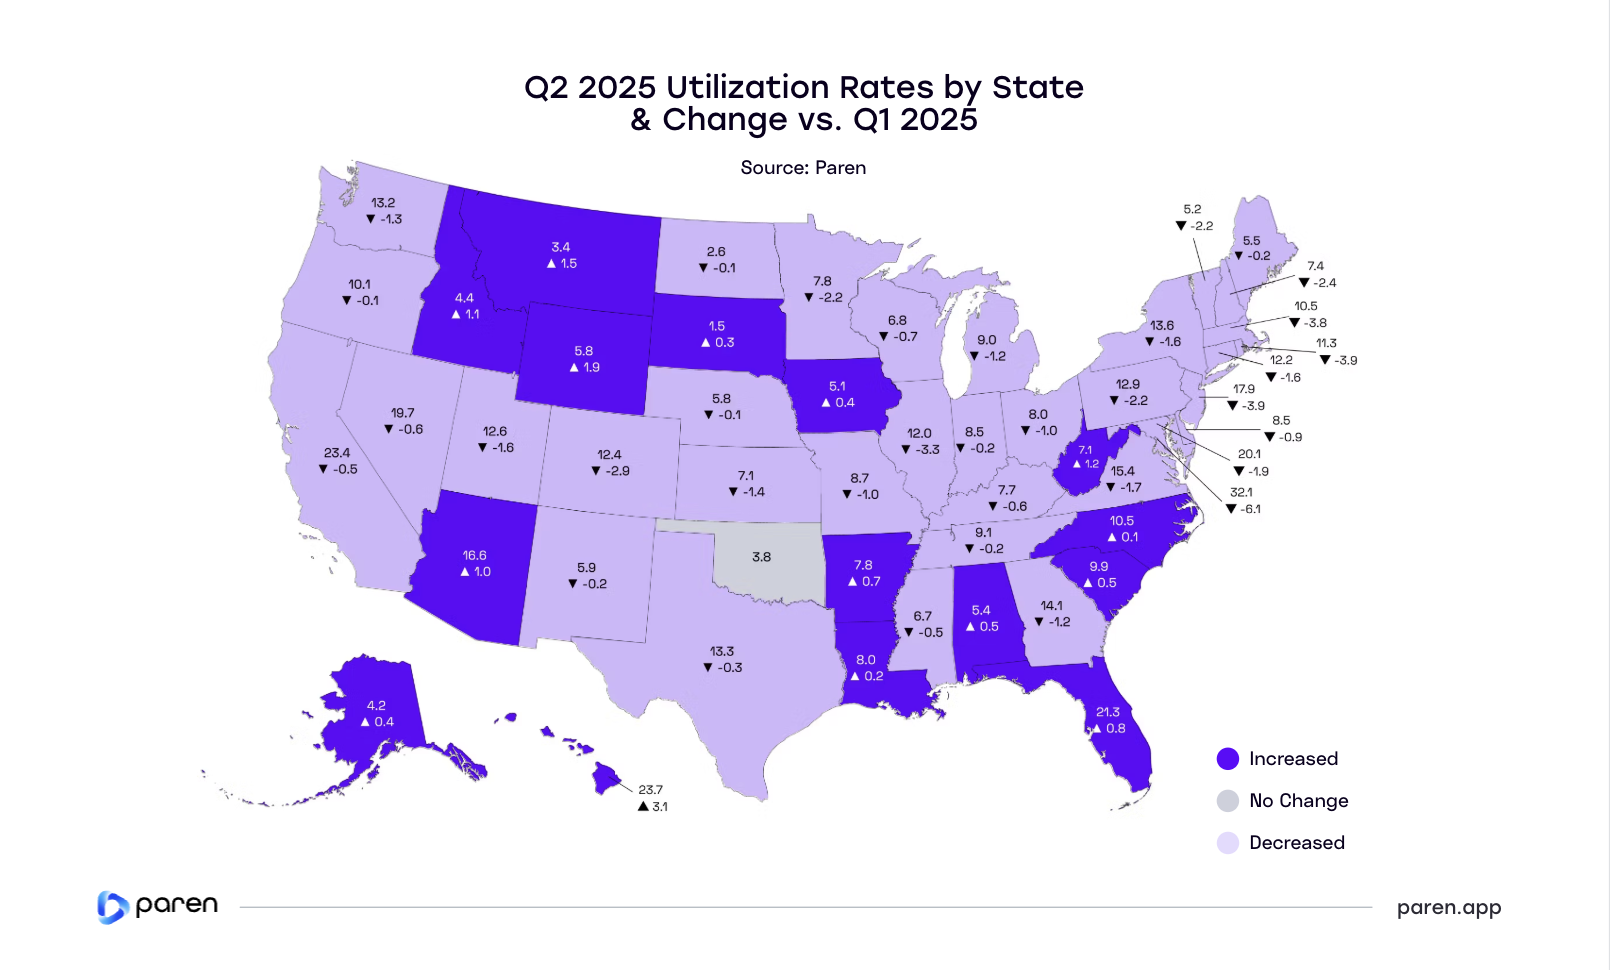
In Q2 2025, fast-charger utilization rates declined in 36 states, underscoring key regional and seasonal differences across the US. Even the District of Columbia, historically the most heavily utilized market, saw a steep 6.1-point drop to 32.1%, though it remained the national leader.
California (23.4%) and New Jersey (17.9%) also posted declines, while Florida (21.3%) rose slightly to become the fourth-highest state (including D.C.) by utilization rate. Hawaii surged to 23.7%, overtaking both CA and NJ—its 3.1-point increase the largest point gain in the country.
Other notable risers included Montana (▲1.5), Wyoming (▲1.9), and Idaho (▲1.1), though they remain among the lower-utilization states overall. States with the biggest drops included Maryland (▼6.1), Rhode Island (▼3.9), and Illinois (▼3.3).
These regional QoQ changes result from a multitude of factors, including the growth of new charging infrastructure versus EV adoption levels, weather (EVs take longer to charge in very cold weather), and seasonality such as EV-driving skiers in New England heading to the slopes in Q1, but less so in Q2.
*Utilization rate calculated as session minutes per station as a percentage of total hours of operation per day.
Las Vegas Maintains Top Spot as San Diego & Phoenix Join the Peak Utilization Leaders
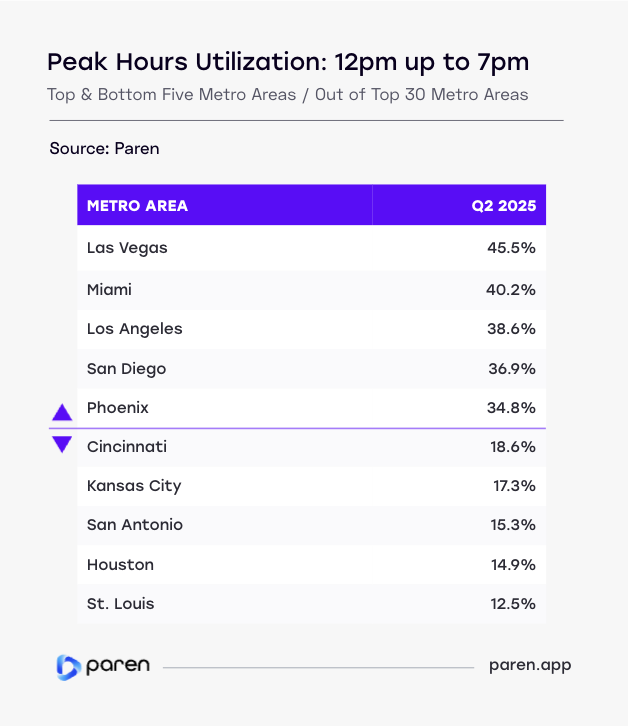
In Q2 2025, peak-time charging activity between 12 pm and up to 7 pm, Las Vegas again topped the list at a 45.5% utilization rate, maintaining its lead from Q1 and reflecting sustained demand from rideshare, tourism, and local EV traffic.
Miami followed at 40.2%, though it dipped slightly from its Q1 rate of 43.1%, while Los Angeles held steady at 38.6%. Two metros joined the top five for the first time this year: San Diego, climbing to 36.9%, and Phoenix, rising sharply to 34.8%.
Interestingly, all five of these MSAs encompass a combination of warm to very hot weather starting in late spring, and are popular travel destinations. High utilization in these markets may be partially attributed to EV drivers visiting the area before the extreme summer temperatures take hold. And surprisingly, the Los Angeles and Phoenix markets both are seeing Waymo capture market share from rideshare drivers, which should have (but didn't) negatively affected sessions from EV-driving Uber and Lyft drivers.
Meanwhile, New York and Tampa, both in the top five last quarter, dropped out of the top tier, with modest declines suggesting stabilization or a slight easing of congestion at key stations.
At the bottom of the list, St. Louis (12.5%), Houston (14.9%), San Antonio (15.3%), Kansas City (17.3%), and Cincinnati (18.6%) posted the lowest peak-hours utilization rates. These cities continue to lag due to lower EV penetration, plenty of infrastructure, and a limited number EV-driving rideshare drivers.
The growing spread between the top and bottom metros underscores that the foundation of strong utilization remains location. However, as the industry matures, pricing, amenities, safety, reliability, and brand loyalty will grow in importance to increase market share and utilization.
Las Vegas & LA Maintain Their Lead with the Highest US Utilization Rates in Q2 2025
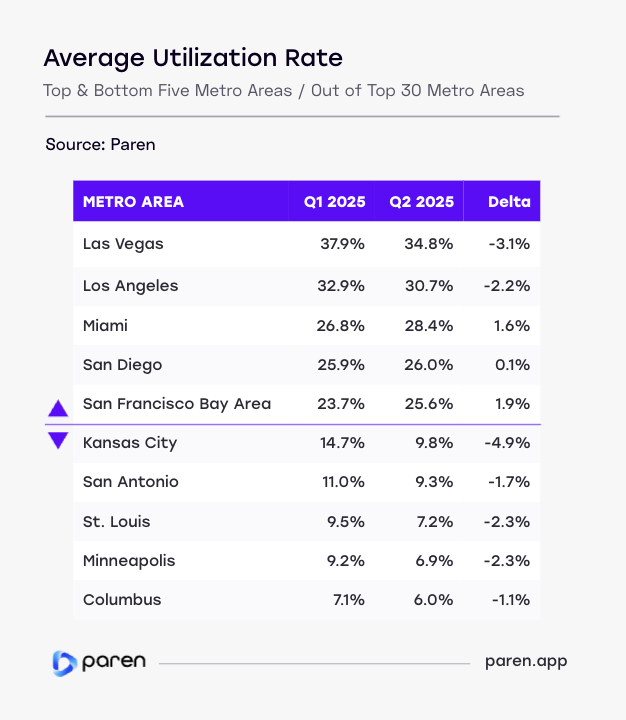
In Q2 2025, Las Vegas once again led all major US metro areas in charging station utilization, averaging 34.8%. While this reflects a decrease from Q1’s 37.9%, it still outpaced Los Angeles (30.7%) and Miami (28.4%), both of which remained in the top five. San Diego held steady at 26.0%, while San Francisco Bay Area broke into the top five for the first time with a notable jump to 25.6%, up nearly two percentage points from Q1.
These top-performing metros share common traits: high population density, significant EV adoption, and heavy demand from travelers and rideshare fleets.
At the opposite end, Columbus, Minneapolis, and St. Louis remain in the bottom tier with utilization rates between 6% and 7%, indicating excess infrastructure and still-developing demand. Kansas City experienced one of the largest drops, falling from 14.7% to 9.8%—a shift that may reflect seasonality or changes in network behavior.
A large portion of the country still suffers from supply greatly outstripping demand.
The wide gap between top- and bottom-tier markets suggests that while many operators are focused on scaling in high-demand urban areas, a large portion of the country still suffers from supply greatly outstripping demand. For long-term success, infrastructure planning may need to become even more tailored—balancing near-term return in saturated metros with long-term access goals in lagging regions.
Reliability of DCFC Stations Improves Slightly
Paren’s US Reliability Index* climbed again in Q2 2025, reaching 85.5, marking the fourth consecutive quarter of improvement. While the pace of gains has moderated slightly, the trajectory is clear: public fast charging—especially among non-Tesla networks—is becoming more dependable and consistent for US EV drivers.
This sustained uptick in performance reflects more than just system fixes. It signals a deeper operational shift across the industry. Networks are prioritizing first-time plug success, making targeted investments in backend infrastructure, and addressing chronic reliability gaps that previously hindered driver confidence. What’s behind the improvements?
- Better execution at launch: Newer stations—especially those funded through public programs like NEVI—are coming online with stricter uptime standards and improved software integration from day one.
- Proactive maintenance: Leading CPOs have implemented smarter diagnostics and faster incident response, allowing them to resolve issues before they escalate.
- Industry learning curve: The past two years of reliability challenges have created urgency for scalable solutions, driving cross-network improvements in hardware selection, contractor accountability, and reporting transparency.
The result is a more stable national network—but not without variation. Reliability still differs by region and operator, and some aging stations remain weak links. As more drivers transition to EVs, especially in markets with fewer Superchargers, the pressure will mount for all providers to meet a rising baseline of performance.
*The Reliability Index is a customer-centric metric that targets one specific outcome: Can I successfully charge at this charger? Connectors are measured on a scale of 0 to 100. In order to achieve a perfect score over the time period, a charger will have to hit first-time plug success every time and remain available when not charging with zero failed charging sessions.
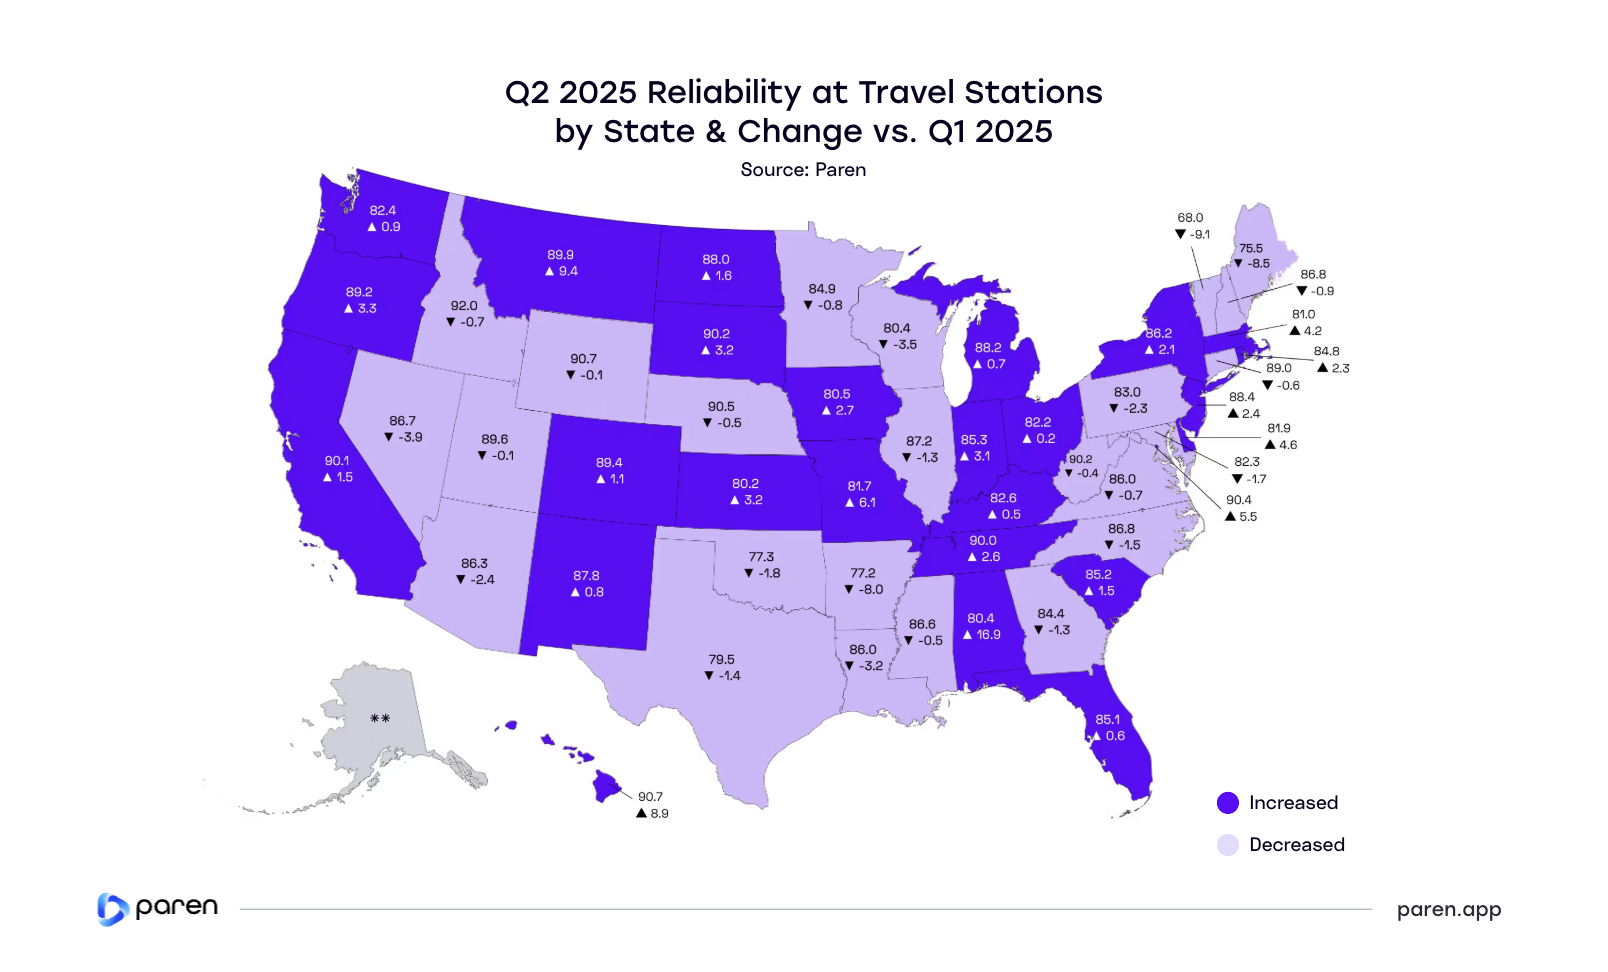
Reliability Among Non-Tesla Travel DCFC Stations is a Mixed Bag in Q2
Reliability among non-Tesla travel fast-charging stations* continued to vary widely in Q2 2025. Idaho (92.0), Wyoming (90.7), Hawaii (90.7), Nebraska (90.5), and D.C. (90.4) led the nation, all Mountain states with relatively small, newer networks and low utilization—factors likely contributing to fewer issues.
At the other end, Vermont (68.0), Maine (75.5), Arkansas (77.2), Oklahoma (77.3), and Texas (79.9) ranked lowest. The contrast suggests that reliability may hinge more on how actively operators manage and maintain their sites than on utilization alone.
Nationwide, 26 states saw reliability improve compared to Q1, while 24 declined.
California continues to be an outlier. With just under 360 travel stations and some of the country’s highest utilization, it still achieved a strong 90.1 score—evidence that well-resourced CPOs can maintain uptime even in high-demand environments.
Nationwide, 24 states saw reliability declines compared to Q1, while 26 improved. States with the largest improvement include Alabama (16.9), Montana (9.4), Hawaii, (8.9), Missouri (6.1), and the District of Columbia (5.5).
*Travel fast-charging stations are defined as those stations with a minimum of four ports providing 100 kW or more of simultaneous charging power.
**Alaska does not have non-Tesla travel stations.
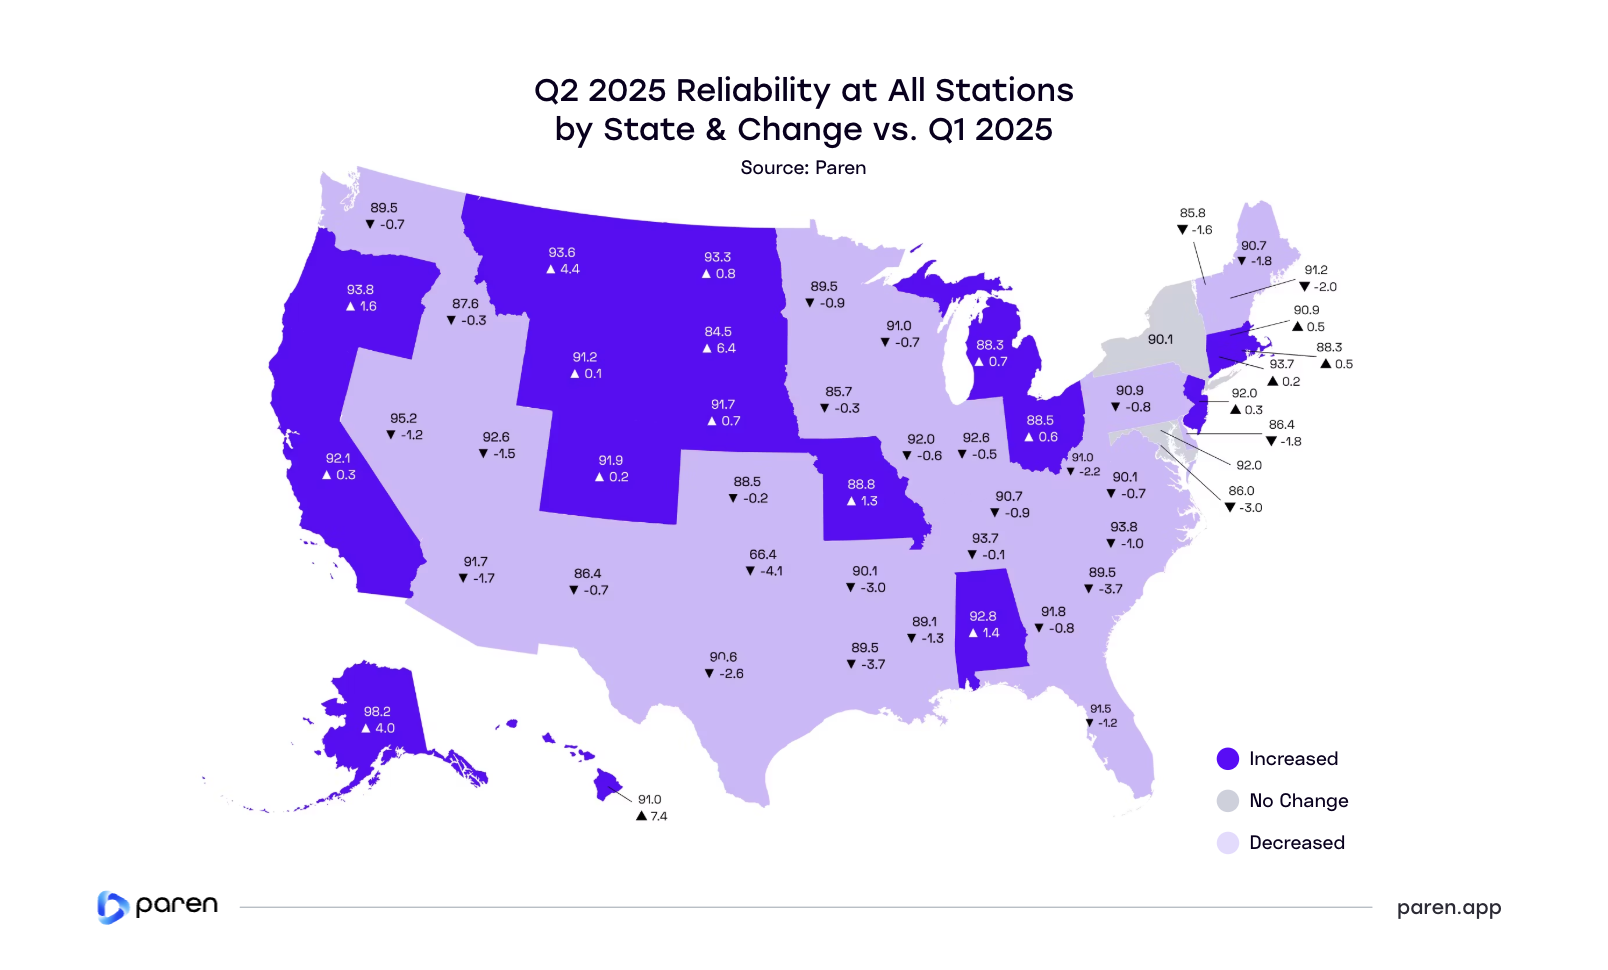
Alaska Stations Most Reliable; Oklahoma Least Reliable
Public fast-charging reliability—for both Tesla and non-Tesla stations—remains uneven across the US in Q2 2025. Alaska (98.2) and Nevada (95.2) posted the highest reliability scores this quarter. Hawaii had the largest improvement of 7.4 points, followed by South Dakota with a 6.4 point increase.
In contrast, several states experienced significant declines. Oklahoma (66.4) remains the lowest-ranking state and fell another 4.1 points from Q1. Much of its network stems from early rounds of public funding—including VW settlement investments—many of which may now be showing their age. Louisiana (89.5) and South Carolina (89.5) also saw noticeable drops of 3.7 points, signaling potential gaps in maintenance or support in less densely populated markets.
In total, 31 states recorded lower reliability scores in Q2, while 18 improved, and two remained the same. California, the state with the most EVs and charging infrastructure had a slight uptick in reliability by 0.3 points, to 92.1.
As more charging stations come online, sustaining high reliability will depend less on network size and more on operator resources and commitment, local responsiveness, and proactive maintenance strategies.
EV Charging Pricing
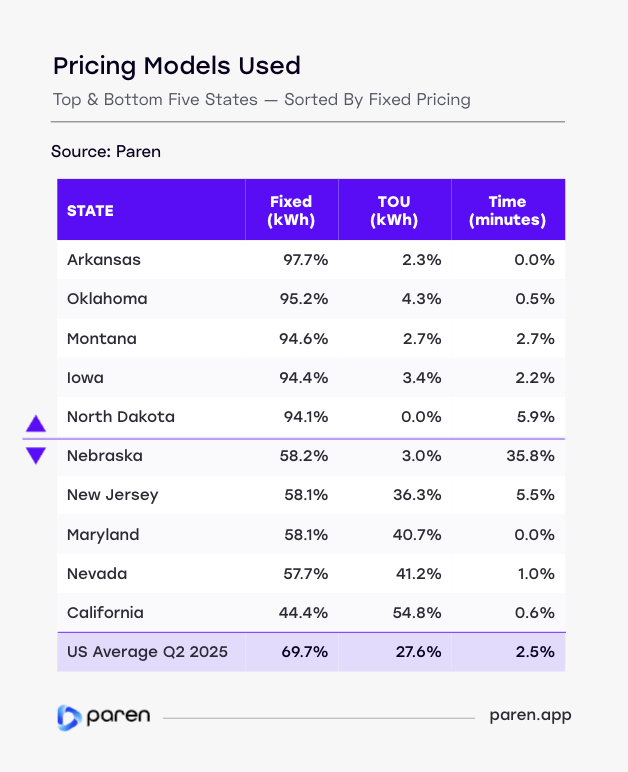
70% of California Stations Use Time-of-Use Rates; While 27.6% is US Average
Pricing models vary significantly across states, shaping how EV drivers experience and understand charging costs. This snapshot compares the top and bottom five states sorted on the percentage of stations in the state using fixed pricing. To avoid anomalies, we excluded states with 25 or fewer fast charging stations.
There are three main types of pricing used by CPOs in the US:
- Fixed pricing refers to a consistent rate per kWh for the entire day.
- TOU (Time-of-Use) pricing changes based on the time of day with higher prices during expected peak demand time. It encourages off-peak charging and can help balance grid demand.
- Time-based pricing charges by the minute or hour and is often used where energy-based pricing is restricted.
In Q2 2025, California remained the only state where TOU pricing surpasses Fixed, while CPOs in many states such as Arkansas, Oklahoma, Montana, Iowa, and North Dakota almost entirely use Fixed pricing models. Fixed pricing still dominates overall, with an average across the states of 69.7%, followed by TOU at 27.6%, and Time at 2.5%.
Not unsurprisingly, the majority of pricing model changes in Q2 are from Fixed to TOU by Electrify America and Tesla in the state of California. We also saw that Tesla has made similar pricing model changes in many other large footprint states, including FL, TX, PA, NY, NJ, NC, MA, and IL.
Charging based on time, such as $0.45 per minute, is declining in popularity and is often used at auto dealerships, single-location site hosts, and non-networked locations in states with very low EV adoption. Nebraska remains an outlier, with nearly 36% of stations charging by time, despite a law change in April 2024 enabling non-utilities to charge by kWh, and not just time.
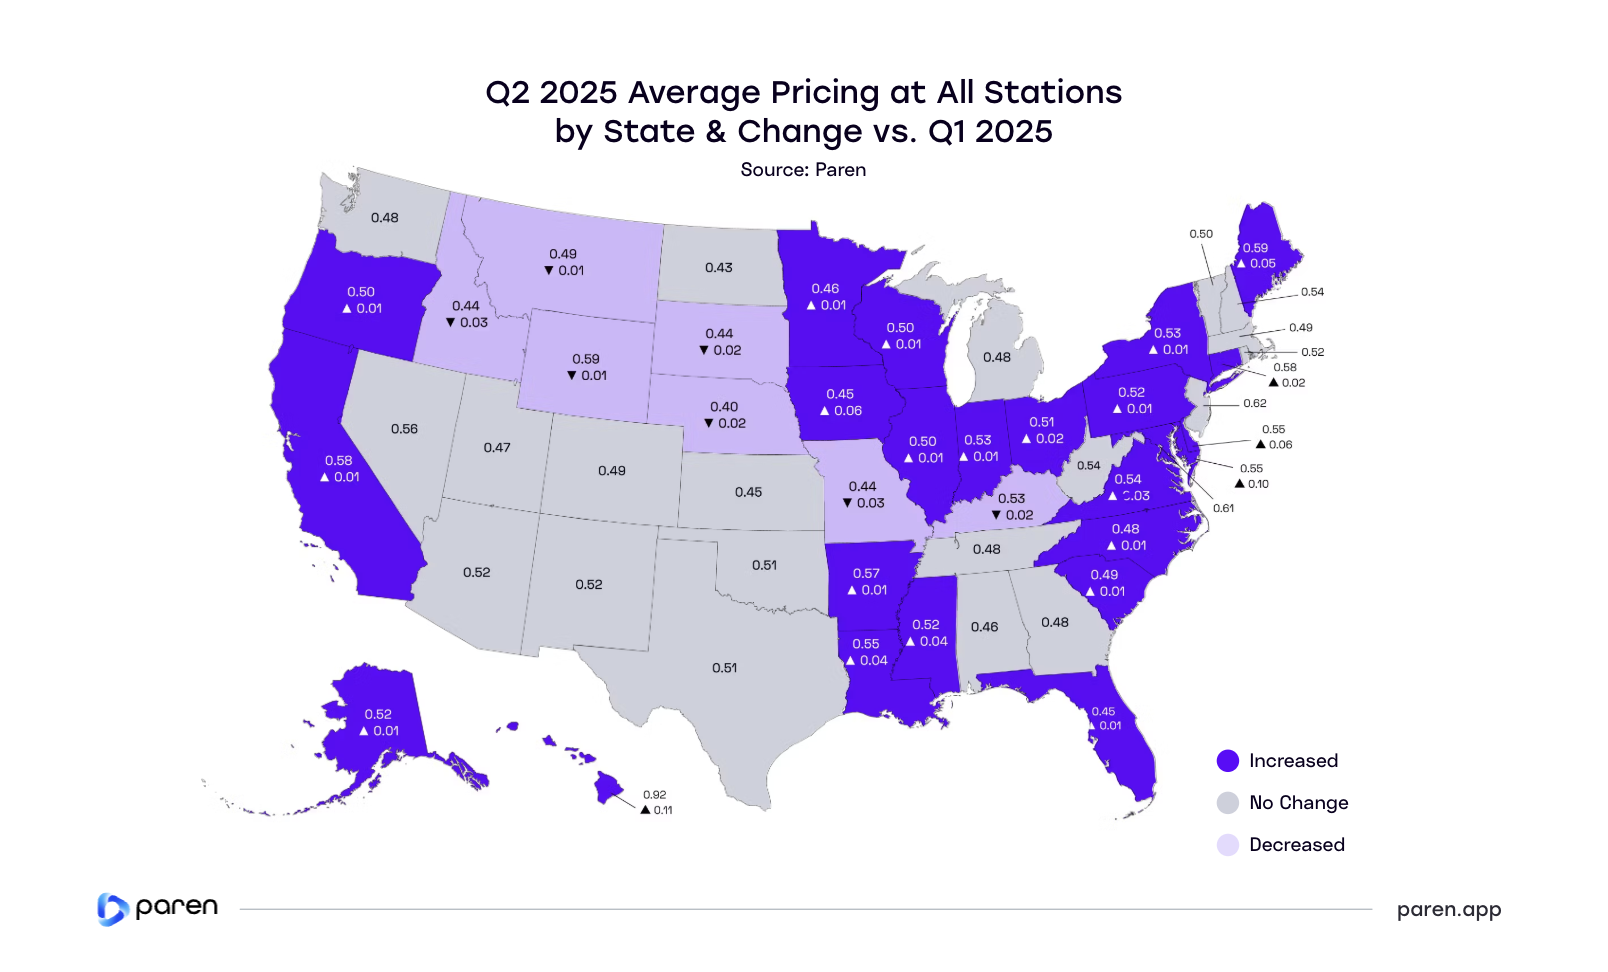
EV Drivers in Hawaii Pay an Average of $0.92 per kWh, Versus $0.41 in Iowa
The map to the right highlights the average (mean) cost per kilowatt-hour (kWh) that EV drivers pay for fast charging across the US, based on the combined Tesla and non-Tesla networks station data for non-members*.
More than half (28) of the states have an average of $0.48 to $0.54 per kWh, but some clear pricing outliers stand out. Hawaii has the highest average non-member pricing at $0.92, followed by New Jersey ($0.62) the District of Columbia ($0.61), Maine ($0.59), and Wyoming ($0.59).
Nebraska has the lowest average price per kWh at $0.40, followed by North Dakota ($0.43), South Dakota ($0.44), Missouri ($0.44), and Idaho ($0.44). Among states with a large EV ownership base, Florida has a low average rate of $0.45, while California is $0.13 higher at $0.58.
Most states saw average prices stay the same, increase, or decrease by one to two cents in Q2. However, a few states saw increases of $0.05 or more: Hawaii ($0.11), Maryland ($0.10), Delaware $0.06), Iowa ($0.06), and Maine ($0.05).
*Average prices do NOT include member discounted prices.
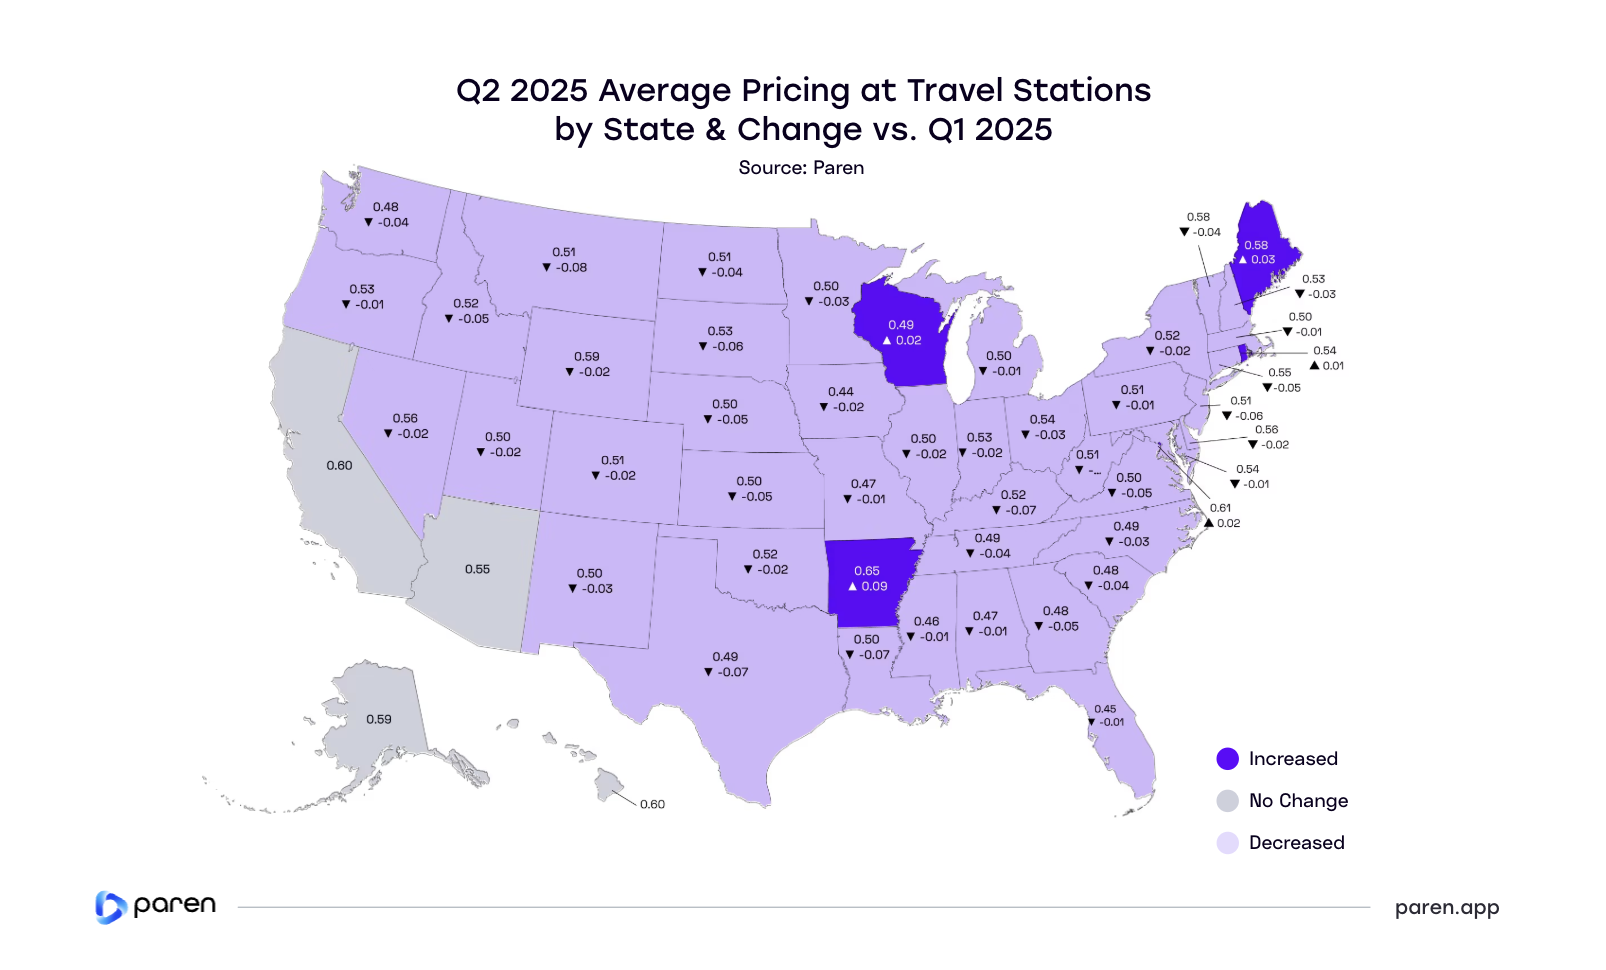
Travel Stations Non-Member Pricing Averages $0.52 per kWh*
This map highlights the average cost per kWh by state that non-member EV drivers pay for fast charging across Tesla and non-Tesla stations with four or more ports of 100 kW or higher.** This data highlights the average prices an EV driver would expect to pay at charging stations operated by national and regional networks that are located along highway corridors or urban and suburban retail locations.
Seventy-five percent of the states have average travel station prices of $0.48 to $0.56 per kWh. Iowa ($0.44), Florida ($0.45), and Mississippi ($0.46) have the lowest average prices. Arkansas ($0.65), D.C. ($0.61), California,($0.60) and Hawaii ($0.60) have the highest average prices.
Interestingly, 42 states saw price decreases in Q2 versus Q1 at travel stations. These decreases are likely due to the growing number of large and new CPOs entering the market and looking to capture market share through aggressive pricing. Once these stations reach certain levels of utilization, these CPOs might start to raise prices and switch to competing on amenities, power levels, reliability, and brand trust.
*Average prices do NOT include member discounted prices.
**Travel fast-charging stations are defined as those stations with a minimum of four ports providing 100 kW or more of simultaneous charging power.
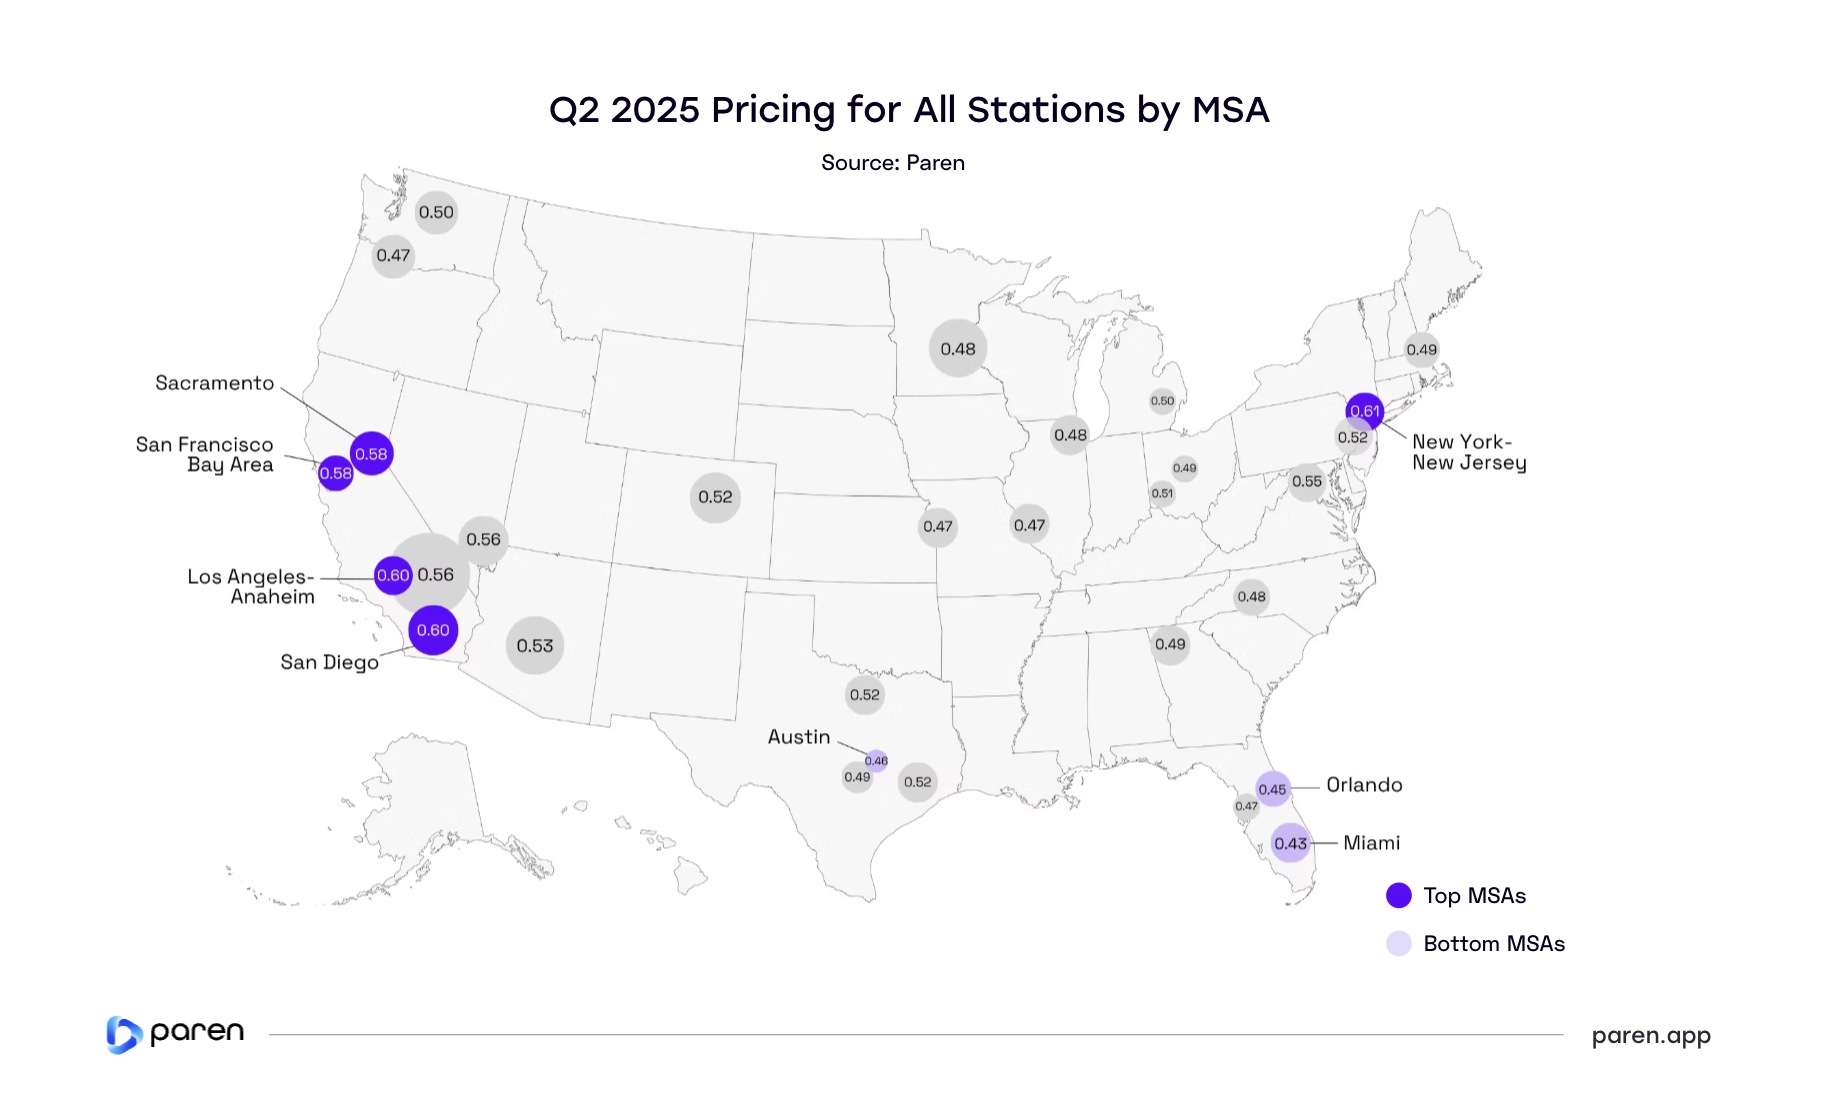
New York–New Jersey Cracks Top 5 Highest-Priced MSAs
This map highlights the average price per kWh across major US metro areas, using combined Q2 2025 pricing data from both Tesla and non-Tesla networks for non-members. (Member-discounted prices are not included.)
For the first time, New York–New Jersey ($0.61) enters the top five highest-priced metro areas, replacing San Bernardino ($0.56). The rest of the top five—San Diego, Los Angeles, Sacramento, and the San Francisco Bay Area—remain consistent, each with average rates of $0.58 per kWh or higher.
Average prices in Florida continue to be lower in part due to the presence of very low pricing from the utility-owned network, Florida Power & Light.
Among the lowest-priced MSAs, Miami held steady at $0.43/kWh from Q1 2025, while Orlando remained in the bottom tier despite a $0.04 increase. Portland saw a $0.03 increase, moving it out of the lowest group, and Austin now ranks among the least expensive, although its price remained unchanged at $0.46. Average prices in Florida continue to be lower in part due to the presence of very low pricing from the utility-owned network, Florida Power & Light.
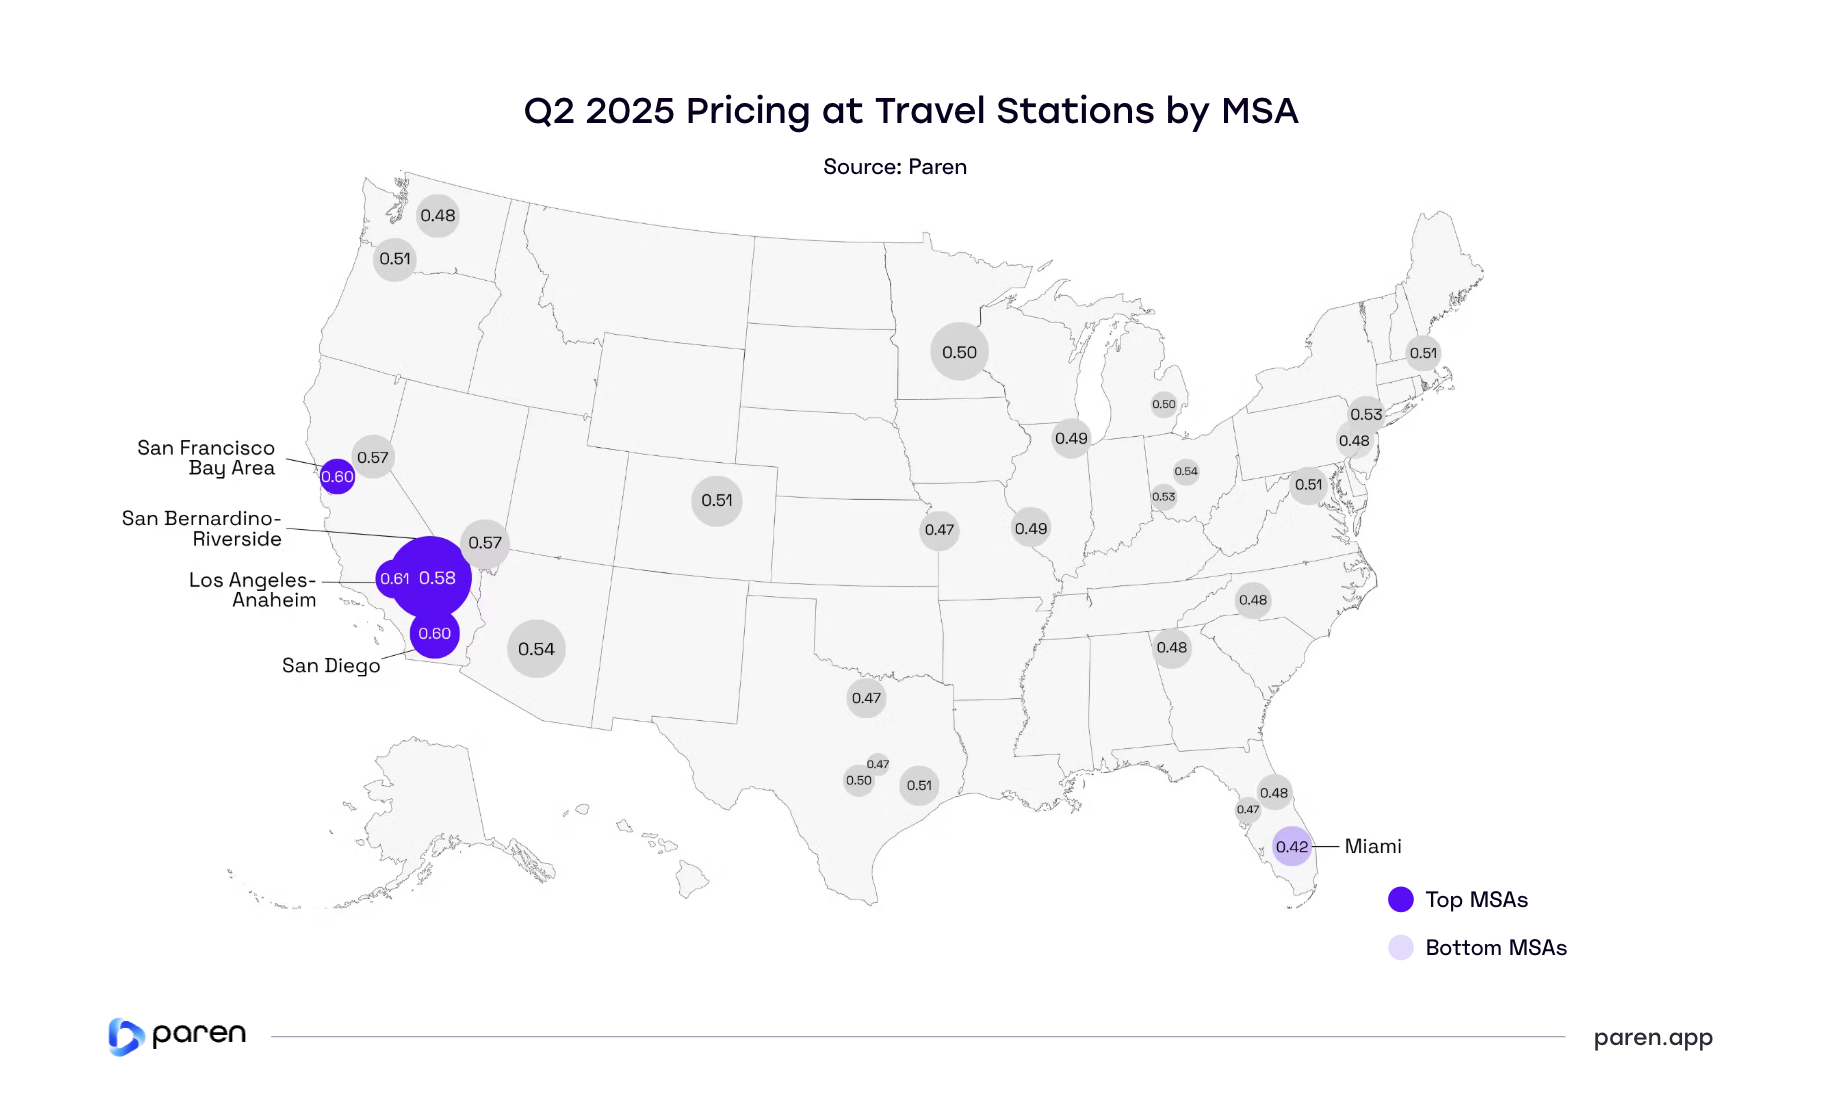
California MSAs Still Dominate the Most Expensive Travel Charging Markets
California continues to lead the nation in fast charging prices. In Q2 2025, the four most expensive MSAs—Los Angeles-Anaheim ($0.61), San Diego ($0.60), San Francisco Bay Area ($0.60), and San Bernardino-Riverside ($0.58)—all remained above the national average.
Overall, the national average dropped from $0.54 in Q1 to $0.51 in Q2.
At the other end of the spectrum, Miami has the lowest average price at $0.42 per kWh, a $0.01 drop from Q1. While several other MSAs reported lower-than-average pricing, four were tied at $0.47—making Miami the only metro clearly standing out at the bottom.
Overall, the national average dropped from $0.54 in Q1 to $0.51 in Q2, with several regions seeing notable decreases. Houston had the largest decline, dropping $0.07 to $0.51, followed by Atlanta and San Antonio, each down $0.06.
Appendices
Appendix A
Charging Infrastructure
- CPO: Charge Point Operator.
- Fast Charging: Charging port of a minimum of 24 kW.
- NACS: North American Charging Standard; Tesla’s charging connector now adopted by many networks.
- NEVI: National Electric Vehicle Infrastructure program under the Bipartisan Infrastructure Law.
- MSA: Metropolitan Statistical Area.
- Connector: A charging plug conforming to CCS, CHAdeMO, or NACS (J3400) standard.
- Port: A charging unit with one or more connectors capable of charging one or two EVs simultaneously.
- Station: A physical location with one or more EVSEs (charging ports).
Utilization & Reliability
- Reliability Index: The Paren-specific calculation that measures charger reliability taking into account recent successful charge sessions with and without retries, failed charge attempts, and station downtime over a specific time period.
- Tesla: Tesla is a reference to the Tesla Superchargers.
- Travel Fast Charging Stations: Stations capable of charging four or more vehicles simultaneously with a minimum power level of 100kW.
- Non-Travel Fast Charging Stations: Stations with a less than four ports and providing less than 100 kW of simultaneous charging power.
- Utilization: The percentage of tracked time spent on both successful and unsuccessful charging activity at a charger over the time period open per day.
EV Charging Pricing
- Fixed Price: Refers to a consistent rate per kWh for the entire charging day.
- Time of Use (TOU): Pricing changes based on the time of day with higher prices during expected peak demand time. It encourages off-peak charging and can help balance grid demand.
- Time: Charges by the minute or hour. Often used where energy-based pricing is restricted.
Methodology Notes
- All data in this report reflects publicly available DCFC stations.
- Pricing section is based on data from Tesla, non-Tesla, and combined sources (member and non-member).
- Some of the Q1 data in this report has been revised or updated from our Q1 2025 report due to continued expansion of network coverage and ongoing refinement of how certain metrics are calculated.
Data Sources
- AFDC+: Paren Infrastructure Dataset
- Select NEVI RFP documents and award data
- Proprietary charging session / utilization models
Appendix B
Metropolitan Statistical Areas
- Atlanta: Atlanta-Sandy Springs-Alpharetta
- Austin: Austin-Round Rock-Georgetown
- Boston: Boston-Cambridge-Newton
- Charlotte: Charlotte-Concord-Gastonia
- Chicago: Chicago-Naperville-Elgin
- Cincinnati: Cincinnati
- Columbus: Columbus
- Dallas: Dallas-Fort Worth-Arlington
- Denver: Denver-Aurora-Lakewood
- Detroit: Detroit-Warren-Dearborn
- Houston: Houston-The Woodlands-Sugar Land
- Kansas City: Kansas City
- Las Vegas: Las Vegas-Henderson-Paradise
- Los Angeles: Los Angeles-Long Beach-Anaheim
- Miami: Miami-Fort Lauderdale-Pompano Beach
- Minneapolis: Minneapolis-St Paul-Bloomington
- New York: New York-Newark-Jersey City
- Orlando: Orlando-Kissimmee-Sanford
- Philadelphia: Philadelphia-Camden-Wilmington
- Phoenix: Phoenix-Mesa-Chandler
- Portland: Portland-Vancouver-Hillsboro
- Sacramento: Sacramento-Roseville-Folsom
- San Antonio: San Antonio-New Braunfels
- San Bernardino: San Bernardino-Riverside-Ontario
- San Diego: San Diego-Chula Vista-Carlsbad
- San Francisco Bay Area: San Francisco-Oakland-Berkeley
- Seattle: Seattle-Tacoma-Bellevue
- St Louis: St Louis
- Tampa: Tampa-St Petersburg-Clearwater
- Washington: Washington-Arlington-Alexandria
Report Team & Company Overview

Want the data behind the data?
Access utilization, reliability, and pricing at the station level across 95%+ of US and Canadian DCFC infrastructure.