US EV Fast Charging — Q3 2025
Paren’s Q3 2025 EV Charging Report highlights a seasonal slowdown in new fast-charging deployments, record-high reliability across U.S. networks, and a rebound in charger utilization driven by summer travel demand. While expansion temporarily eased during the quarter, the market continues to mature as operators emphasize reliability, uptime, and network performance over sheer growth. The report also examines stable pricing trends, Tesla’s continued leadership in quarterly port additions, and the broader shift toward a more resilient and driver-focused EV charging ecosystem.
Report Overview & Highlights - Q3 2025
Welcome to the Paren 2025 Q3 U.S. EV Fast Charging report. We’ve made significant additions to our dataset and recalculated some metrics from our previous reports to include new data.
While the rate of newly open fast charging stations slowed from the previous quarter, Q3 2025 charging deployment across the U.S. followed previous year's trends and is still on pace to meet or beat Paren's projections of 16,700 new ports in 2025.
Summer EV drivers benefited from this growing infrastructure. Our trend analysis continues to indicate that the introduction of new stations, the retirement of some legacy, poorly maintained sites, and the ongoing station refreshes have improved the quarter reliability score from an adjusted 92.1 to 92.3.
Similar to 2024, utilization trends were up in Q3 2025 as summer travel season showed across-the-board increases in EV charging sessions in most states supported by the growing infrastructure, especially with the number of larger, 8+ port stations from all networks.
Pricing remained largely unchanged, up $0.01 from Q2 to $0.49/kWh across the 12,000+ stations in our sample. We saw several CPOs offering reduced rates to kick off the summer as well as many newly opened stations still offering introductory rates, all benefiting EV drivers using public charging infrastructure.
For even deeper insights, please reach out to us at hello@paren.app for a demo, conversation, or general Q&A.
The Paren Team
Quarter on quarter, the pace of new deployments slowed slightly, following a seasonal pattern.
But EV Drivers enjoyed a more robust and extensive network of fast charging stations during the summer.
Utilization rates and reliability are noticeably up while prices remained mostly unchanged.
— The Paren Team

Charging Infrastructure Expansion
Total Ports Climb to 64,486 — Despite Slower Q3 Openings
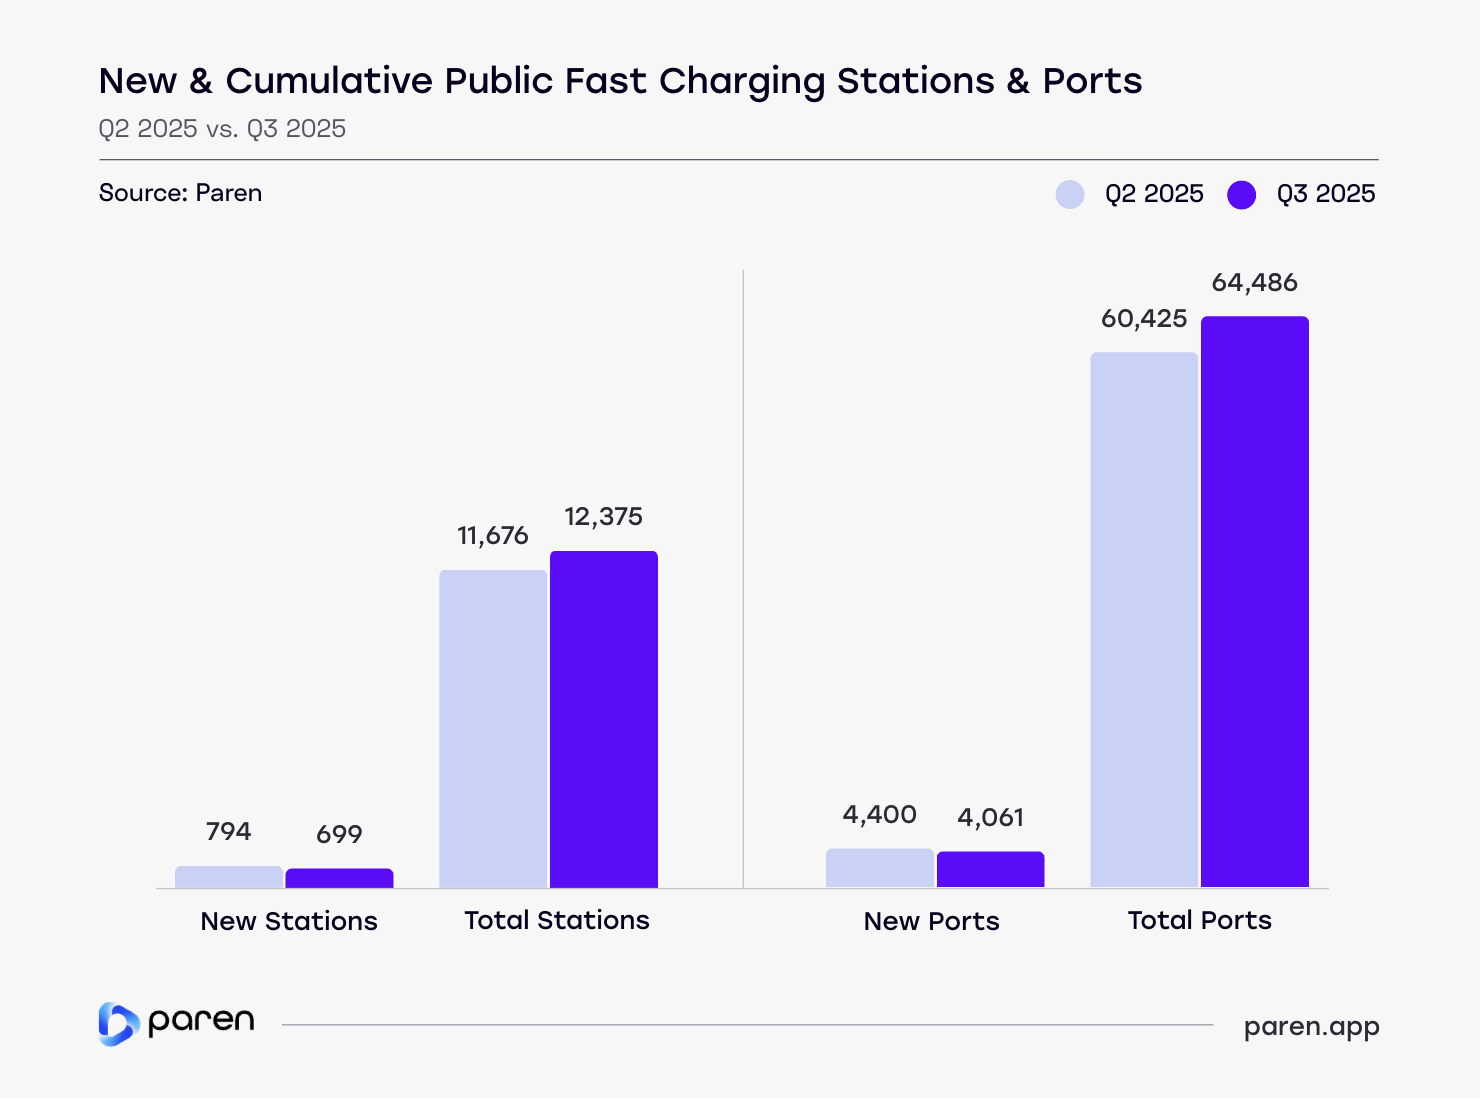
The U.S. fast-charging network continued to expand in Q3 2025, reaching 12,375 stations and 64,486 ports nationwide, accounting for closed stations.
New openings slowed quarter over quarter
Operators added 699 new stations (down 12% from 794 in Q2) and 4,061 new ports (down 7.7% from 4,400).
Quarterly trends
The Q3 dip is consistent with 2024 quarterly trends and we expect a rise in Q4 to meet or beat our projection of 16,700 ports for calendar 2025. Early October station growth numbers are very strong, which backs up these claims.
While the overall average ports per station stayed steady, it is noteworthy that 27% of the stations deployed have 8 or more charging stalls, up from 23% the previous quarter.
The increase in the number of larger stations is what accounts for the 12% decline in station count but only a 7.7% decline in port count.
Tesla Widens Quarterly Lead; Market Still Broadens
Overall trend
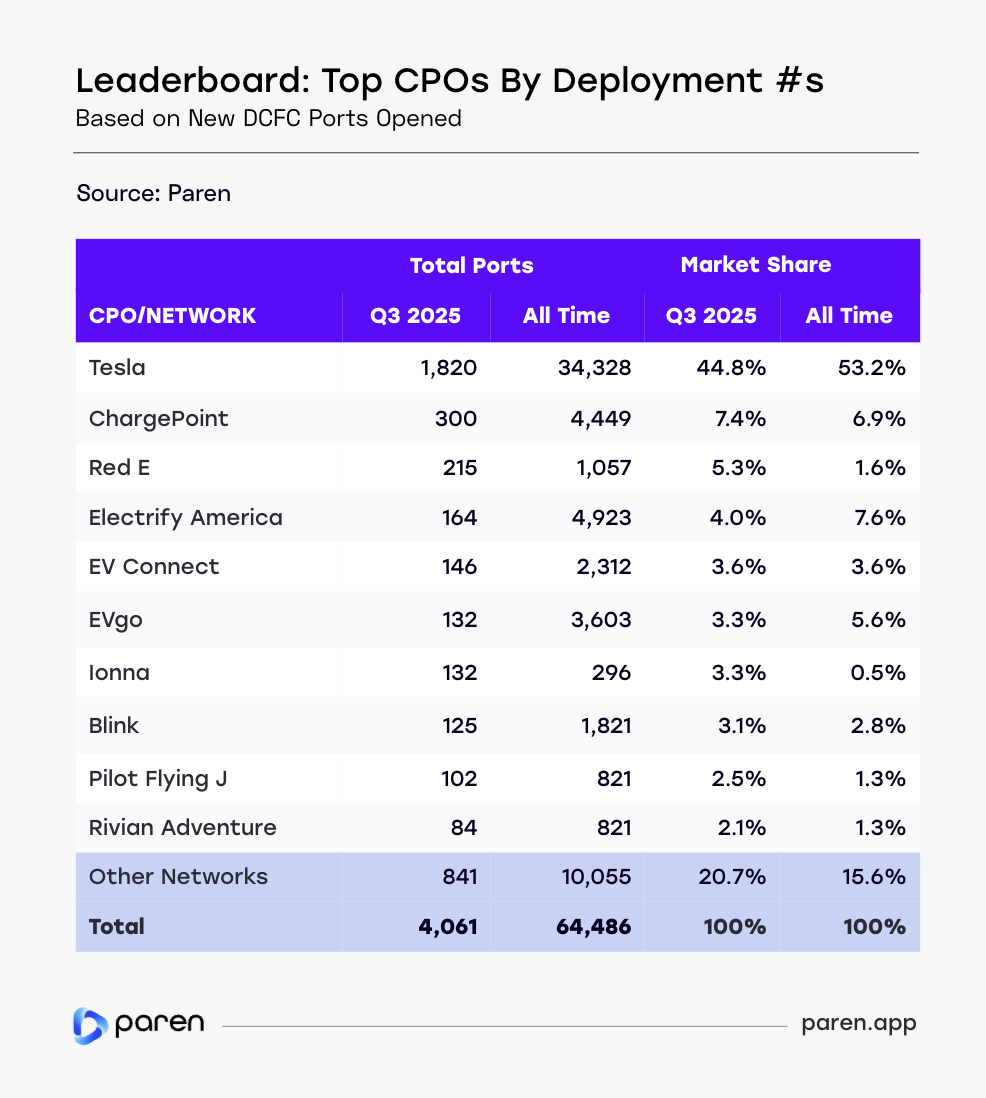
Tesla led Q3 deployments with 1,820 new ports, accounting for 44.8% of all openings. The next largest contributors were ChargePoint (300; 7.4%) and Red E (215; 5.3%), with Electrify America (164; 4.0%) and EV Connect (146; 3.6%) close behind. “Other Networks” collectively added 841 ports (20.7%), underscoring the breadth of smaller and regional operators contributing to growth.
Each state gained at least one station
Each of the 50 states saw at least one new public fast charging station in Q3. As expected, California led the way with 108 stations (15%) followed by Texas (7%), New York (6%), Florida (5.5%), and Illinois (5%).
CPO notes
Ionna's 12 new stations with 132 ports continue their significant quarter over quarter growth having only started rolling out stations earlier this year.
Red E jumped to 3rd place on the leaderboard, expanding beyond their home state of Michigan across 18 additional states with rollouts at Aldi's grocery stores and smaller convenience store chains.
Quarterly results favor Tesla, but the overall network is widening—more operators are contributing meaningful additions each quarter.
Utilization & Reliability
Broad Gains Across the U.S.
A summer in high demand
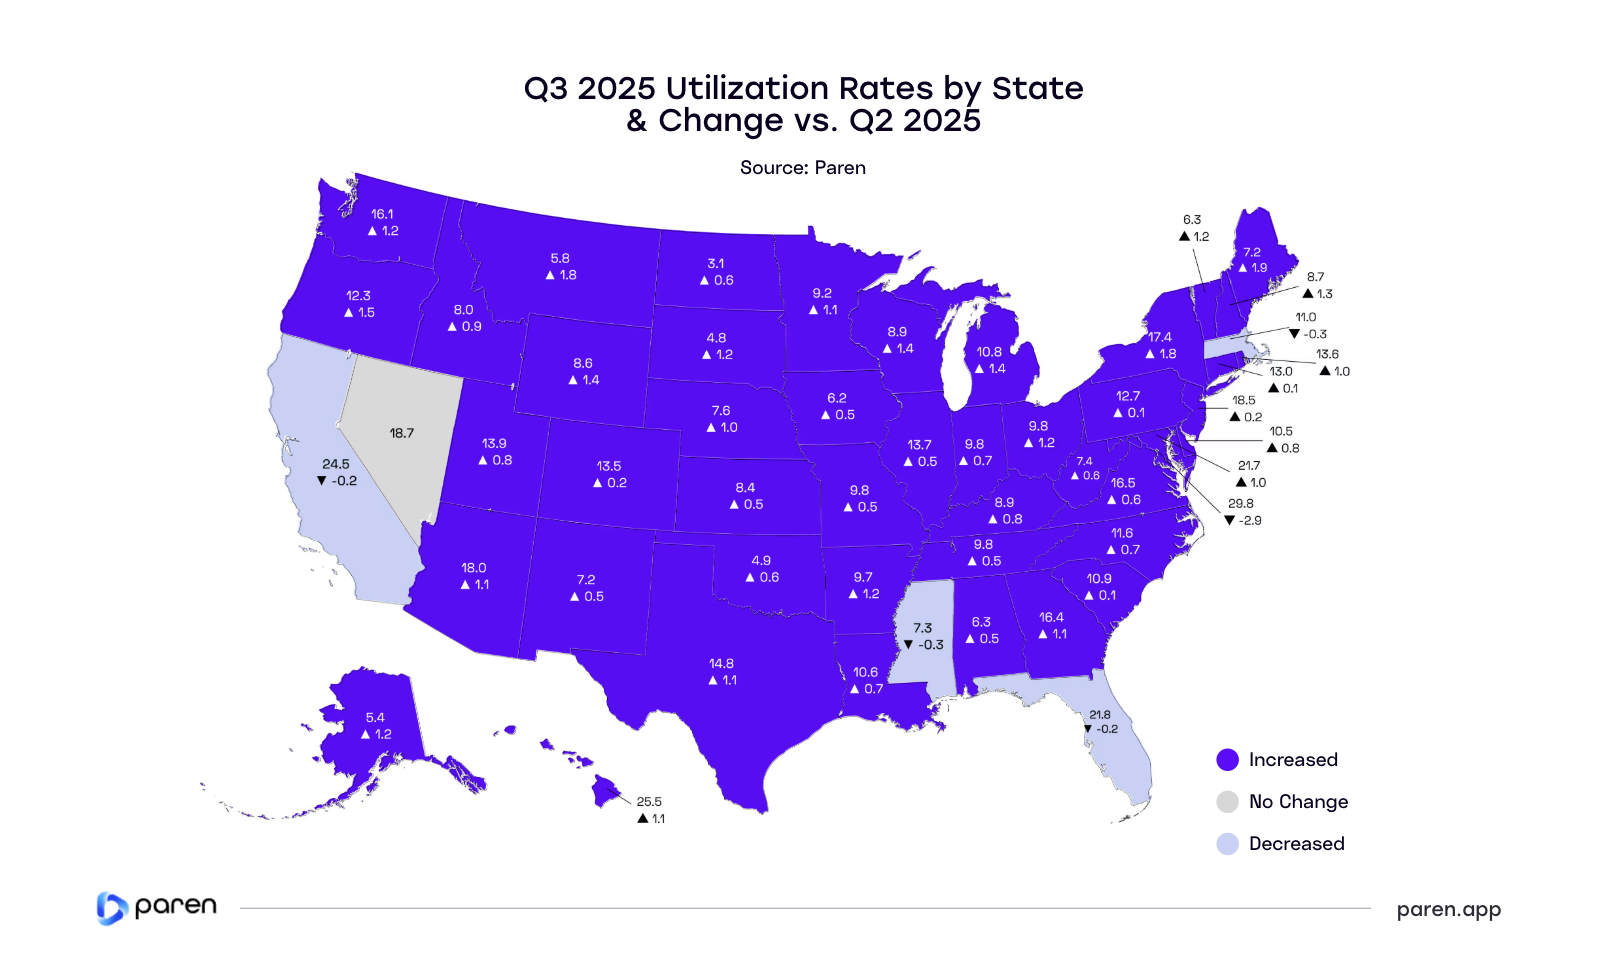
Fast-charger utilization rebounded in Q3 2025: 45 states increased, one was flat, and five declined. Summer road-trip traffic lifted session minutes along interstates and tourism routes, helping demand stabilize and spread more evenly than in Q2.
Top movers
Maine (+1.9 in utilization growth) led the nation, followed by Montana (+1.8), New York (+1.8), Oregon (+1.5)—all consistent with heavier summer travel, and their maturing highway and corridor buildouts.
The District of Columbia stands out with the sharpest decline for the quarter (29.8%, −2.9) likely due to congress going on holiday for parts of the summer.
Are non-Tesla drivers shifting?
We are starting to see a usage pattern that suggests an impact of Tesla opening up its Supercharger access. Quarterly utilization declines at some non-Tesla stations which suggests that some drivers are making a more permanent switch to the Tesla charging sites.
*Utilization rate calculated as session minutes per station as a percentage of total hours of operation per day.
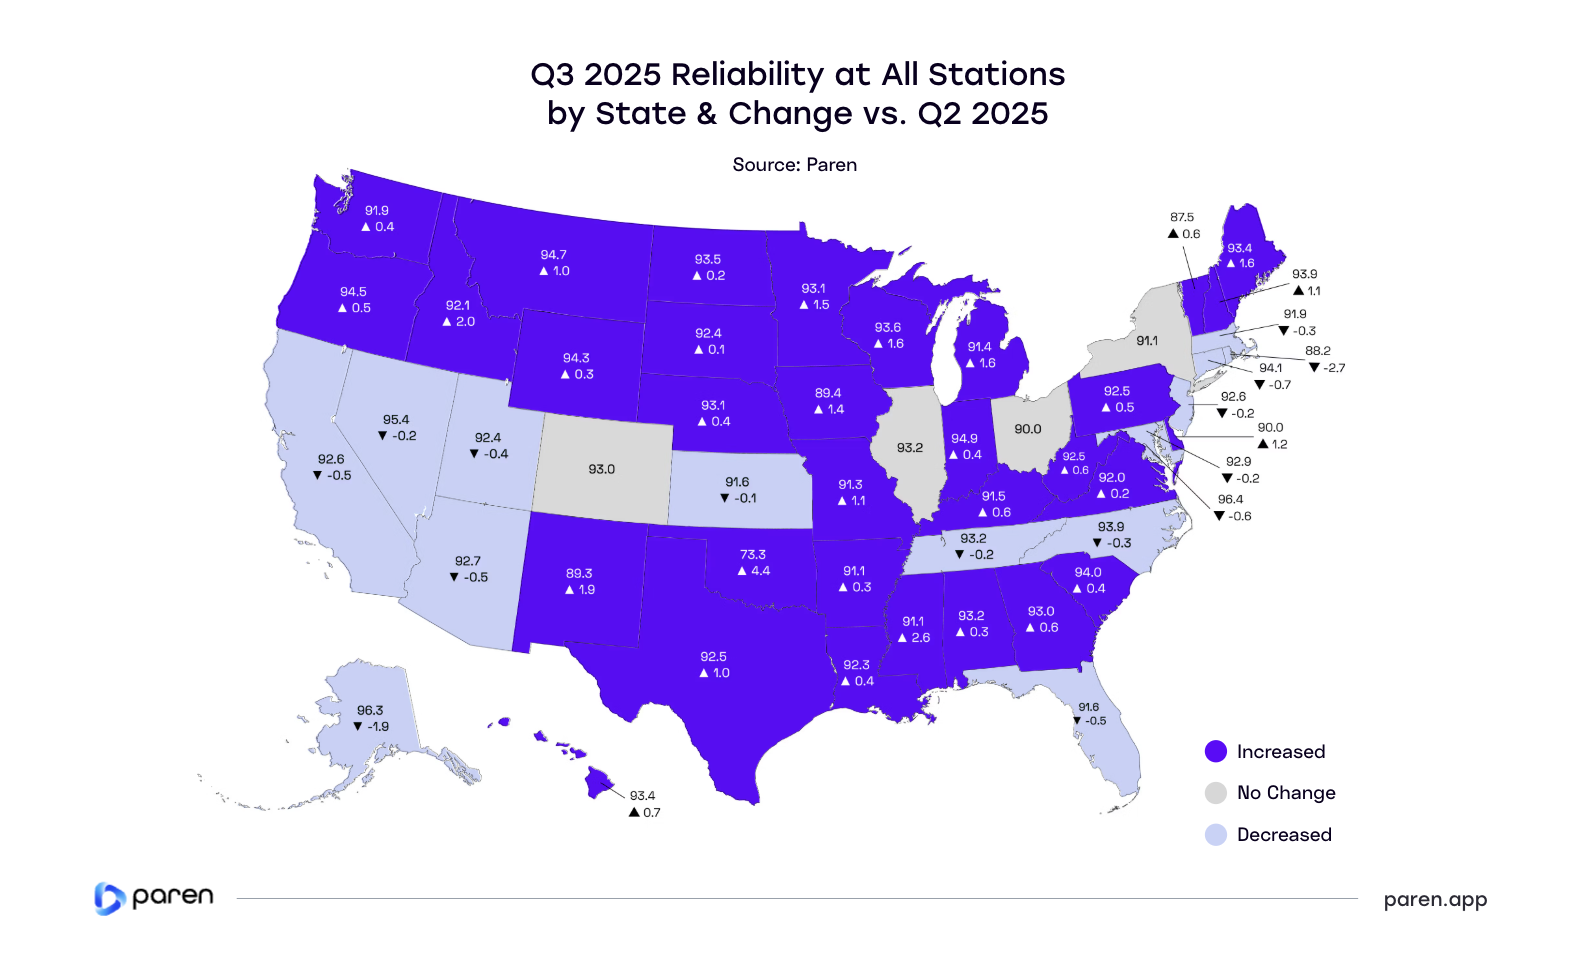
Reliability Mixed, But More States Improving
Q3 2025 saw 32 states improve reliability scores, while 15 declined, and 4 remained unchanged. Although challenges remain, the balance has shifted more positively compared with earlier quarters.
Top movers
Oklahoma (73.3, +4.4) remained the lowest-ranked state but showed the strongest quarter-over-quarter gain, while Mississippi (91.1, +2.6) and Idaho (92.1, +2) also posted notable improvements. On the downside, Rhode Island (88.2, -2.7) and Alaska (96.3, -1.9) recorded declines, highlighting the fragility of even high-scoring networks.
Among top markets, shifts were modest. Nevada (95.4, -0.2), California (92.6, -0.5) and New Jersey (92.6, -0.2) slipped slightly, while Texas (92.5, 1.0) hedged higher. These movements suggest that reliability is less about geography and more tied to operator performance, site age, and proactive maintenance.
Maintenance is becoming increasingly more strategic
As more federally and state-funded chargers go live, the challenge is no longer just buildout but upkeep.
Operators that invest in preventive maintenance, faster outage response, and software integration will be best positioned to maintain user trust as utilization continues to rise.
EV Charging Pricing
Prices Tick Up to $0.49 — Summer Lift, Persistent Regional Gaps
In Q3 2025, the national average fast-charging price ticked up to $0.49/kWh, with most states clustered between $0.48–$0.54.
The highs and the lows
High-price outliers remain: Hawaii ($0.85), the District of Columbia ($0.63), New Jersey ($0.62), and Maine ($0.60). On the low end, Nebraska ($0.42) leads, with North Dakota ($0.45) and Iowa ($0.44) among the cheapest.
Top movers
Largest QoQ movers: Alaska (+$0.04), New Hampshire, South Carolina, and Rhode Island all increased by $0.03; largest declines were Arkansas (−$0.05), Hawaii (−$0.07), and Vermont (−$0.04). Most other states shifted just $0.01–$0.02
Correlation between pricing and usage?
We saw CPOs get aggressive around the Fourth of July holiday pricing, with several sites temporarily cutting rates for two weeks. Despite this, our analysis shows there is not yet a correlation between pricing and utilization. Whether prices increase more significantly post-summer is uncertain and will depend on wholesale electricity trends, regional demand, and competitive moves.

Appendix
Charging Infrastructure
- CPO: Charge Point Operator.
- Fast Charging: Charging port of a minimum of 24 kW.
- NACS: North American Charging Standard; Tesla’s charging connector now adopted by many networks.
- NEVI: National Electric Vehicle Infrastructure program under the Bipartisan Infrastructure Law.
- Connector: A charging plug conforming to CCS, CHAdeMO, or NACS (J3400) standard.
- Port: A charging unit with one or more connectors capable of charging one or two EVs simultaneously.
- Station: A physical location with one or more EVSEs (charging ports).
Utilization & Reliability
- Reliability Index: The Paren-specific calculation that measures charger reliability taking into account recent successful charge sessions with and without retries, failed charge attempts, and station downtime over a specific time period.
- Tesla: Tesla is a reference to the Tesla Superchargers.
- Utilization: The percentage of tracked time spent on both successful and unsuccessful charging activity at a charger over the time period open per day.
EV Charging Pricing
- Fixed Price: Refers to a consistent rate per kWh for the entire charging day.
- Time of Use (TOU): Pricing changes based on the time of day with higher prices during expected peak demand time. It encourages off-peak charging and can help balance grid demand.
- Time: Charges by the minute or hour. Often used where energy-based pricing is restricted.
Methodology Notes
- All data in this report reflects publicly available DCFC stations.
- Pricing section is based on data from combined sources: Tesla, non-Tesla and member and non-member.
- Some of the Q2 data referenced in this report has been revised or updated from our Q1 and Q2 2025 reports due to continued expansion of network coverage and ongoing refinement of how certain metrics are calculated, including our reliability score.
Data Sources
- AFDC+: Paren Infrastructure Dataset
- Select NEVI RFP documents and award data
- Proprietary charging session / utilization models
About Paren
About our quarterly reports
As a neutral platform, Paren uniquely aggregates, enriches and standardizes fast charging across North America. We started these quarterly reports to provide EV charging leaders with a richer perspective on the broader industry dynamics using our unique data and insights.
We value your feedback, email us at: hello@paren.app
Interested in deeper insights?
- Follow Paren on LinkedIn ↗ link
- Check our blog posts ↗ link
- Read about Paren in the news ↗ link
- Track our monthly CPO/Network leaderboard ↗ link
Working with Paren
Paren is a real-time data platform for electric vehicle charging that standardizes reliability, availability, pricing, and amenities across networks, enriching over 3 millions of sessions each week to give automakers, charge point operators, map makers, and government entities the insights they need to improve transparency, expand infrastructure, and accelerate EV adoption.
Paren offers live and historical access to data insights over more than 60K DCFC ports:
- Flat files - Rich datasets for BI tools
- API - Real time access to granular insights
- Online portal - Self serve portal for specific projects
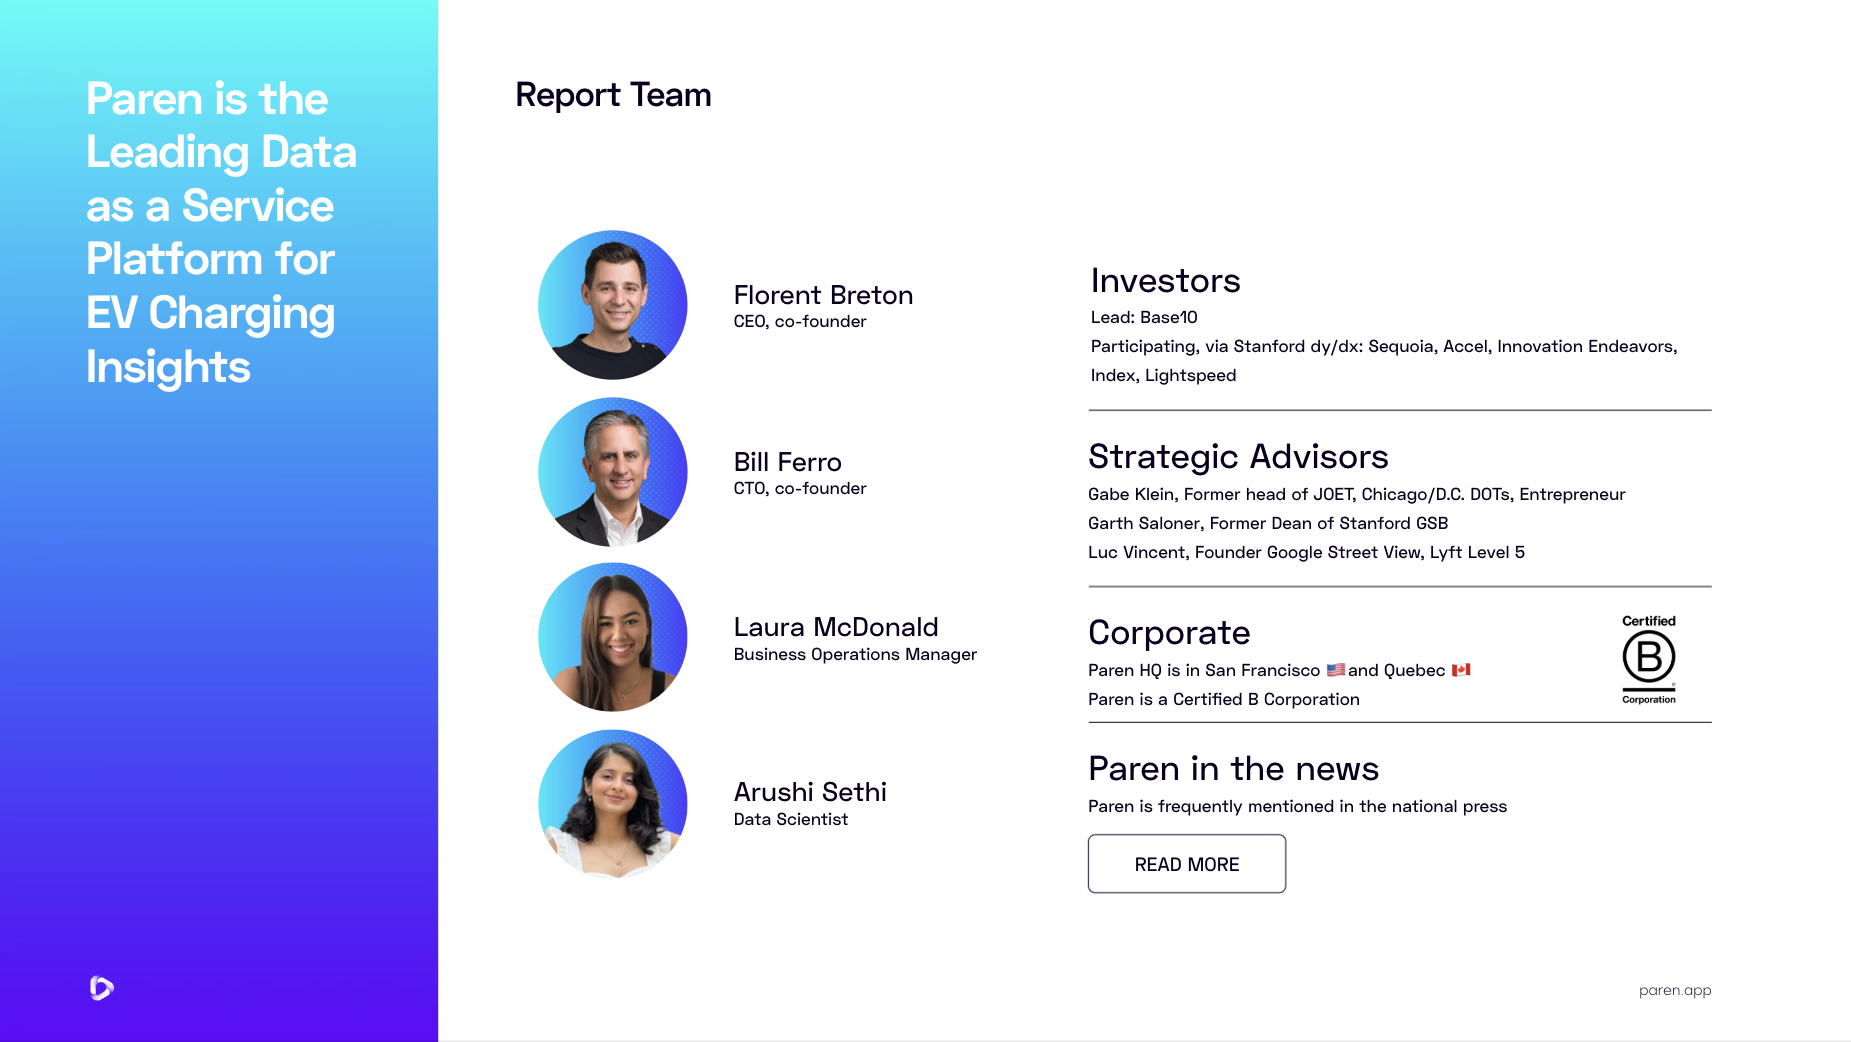
Report Team
Want the data behind the data?
Access utilization, reliability, and pricing at the station level across 95%+ of US and Canadian DCFC infrastructure.