US EV Fast Charging — Q2 2026
The State of the EV Charging Industry Q2 2026 report provides comprehensive analysis of the US fast-charging landscape. Explore deployment trends across 806 new public stations, utilization rates by state, reliability clusters, and pricing models. Data-driven insights on NACS adoption, port density, and market concentration across leading networks.

About This Report
The State of the Industry report is Paren's quarterly deep-dive into U.S public fast charging — tracking infrastructure growth, network reliability, operator market share, deployment and pricing trends. We publish it free of charge to give the industry a shared, standardized view of the data. It is independent work: not sponsored, and not affiliated with any charge point operator or automaker.
Data reflects all publicly accessible DCFC ports in the U.S., updated daily — Paren monitors more than 99% of the U.S. DCFC infrastructure in real time. In this edition, we've also given the floor to a leading industry expert to share their perspective on where the market is heading. We hope you enjoy the report.
Industry Perspective: Guest View
Paren's Q2 SOTI Data Reveal Mixed Signals for CPOs
Newer CPOs aggressively expanding footprint, while incumbents focus on customer experience and profitability
Q2 2026 was another strong quarter for the deployment and performance of DC charging stations in the US, but Paren's data also points to warning signs — especially for second-tier and local/regional CPOs.
For EV drivers, the positive story is that deployment continues to keep pace with growth in vehicles in operation, as reflected in strong session growth while utilization remains relatively flat.
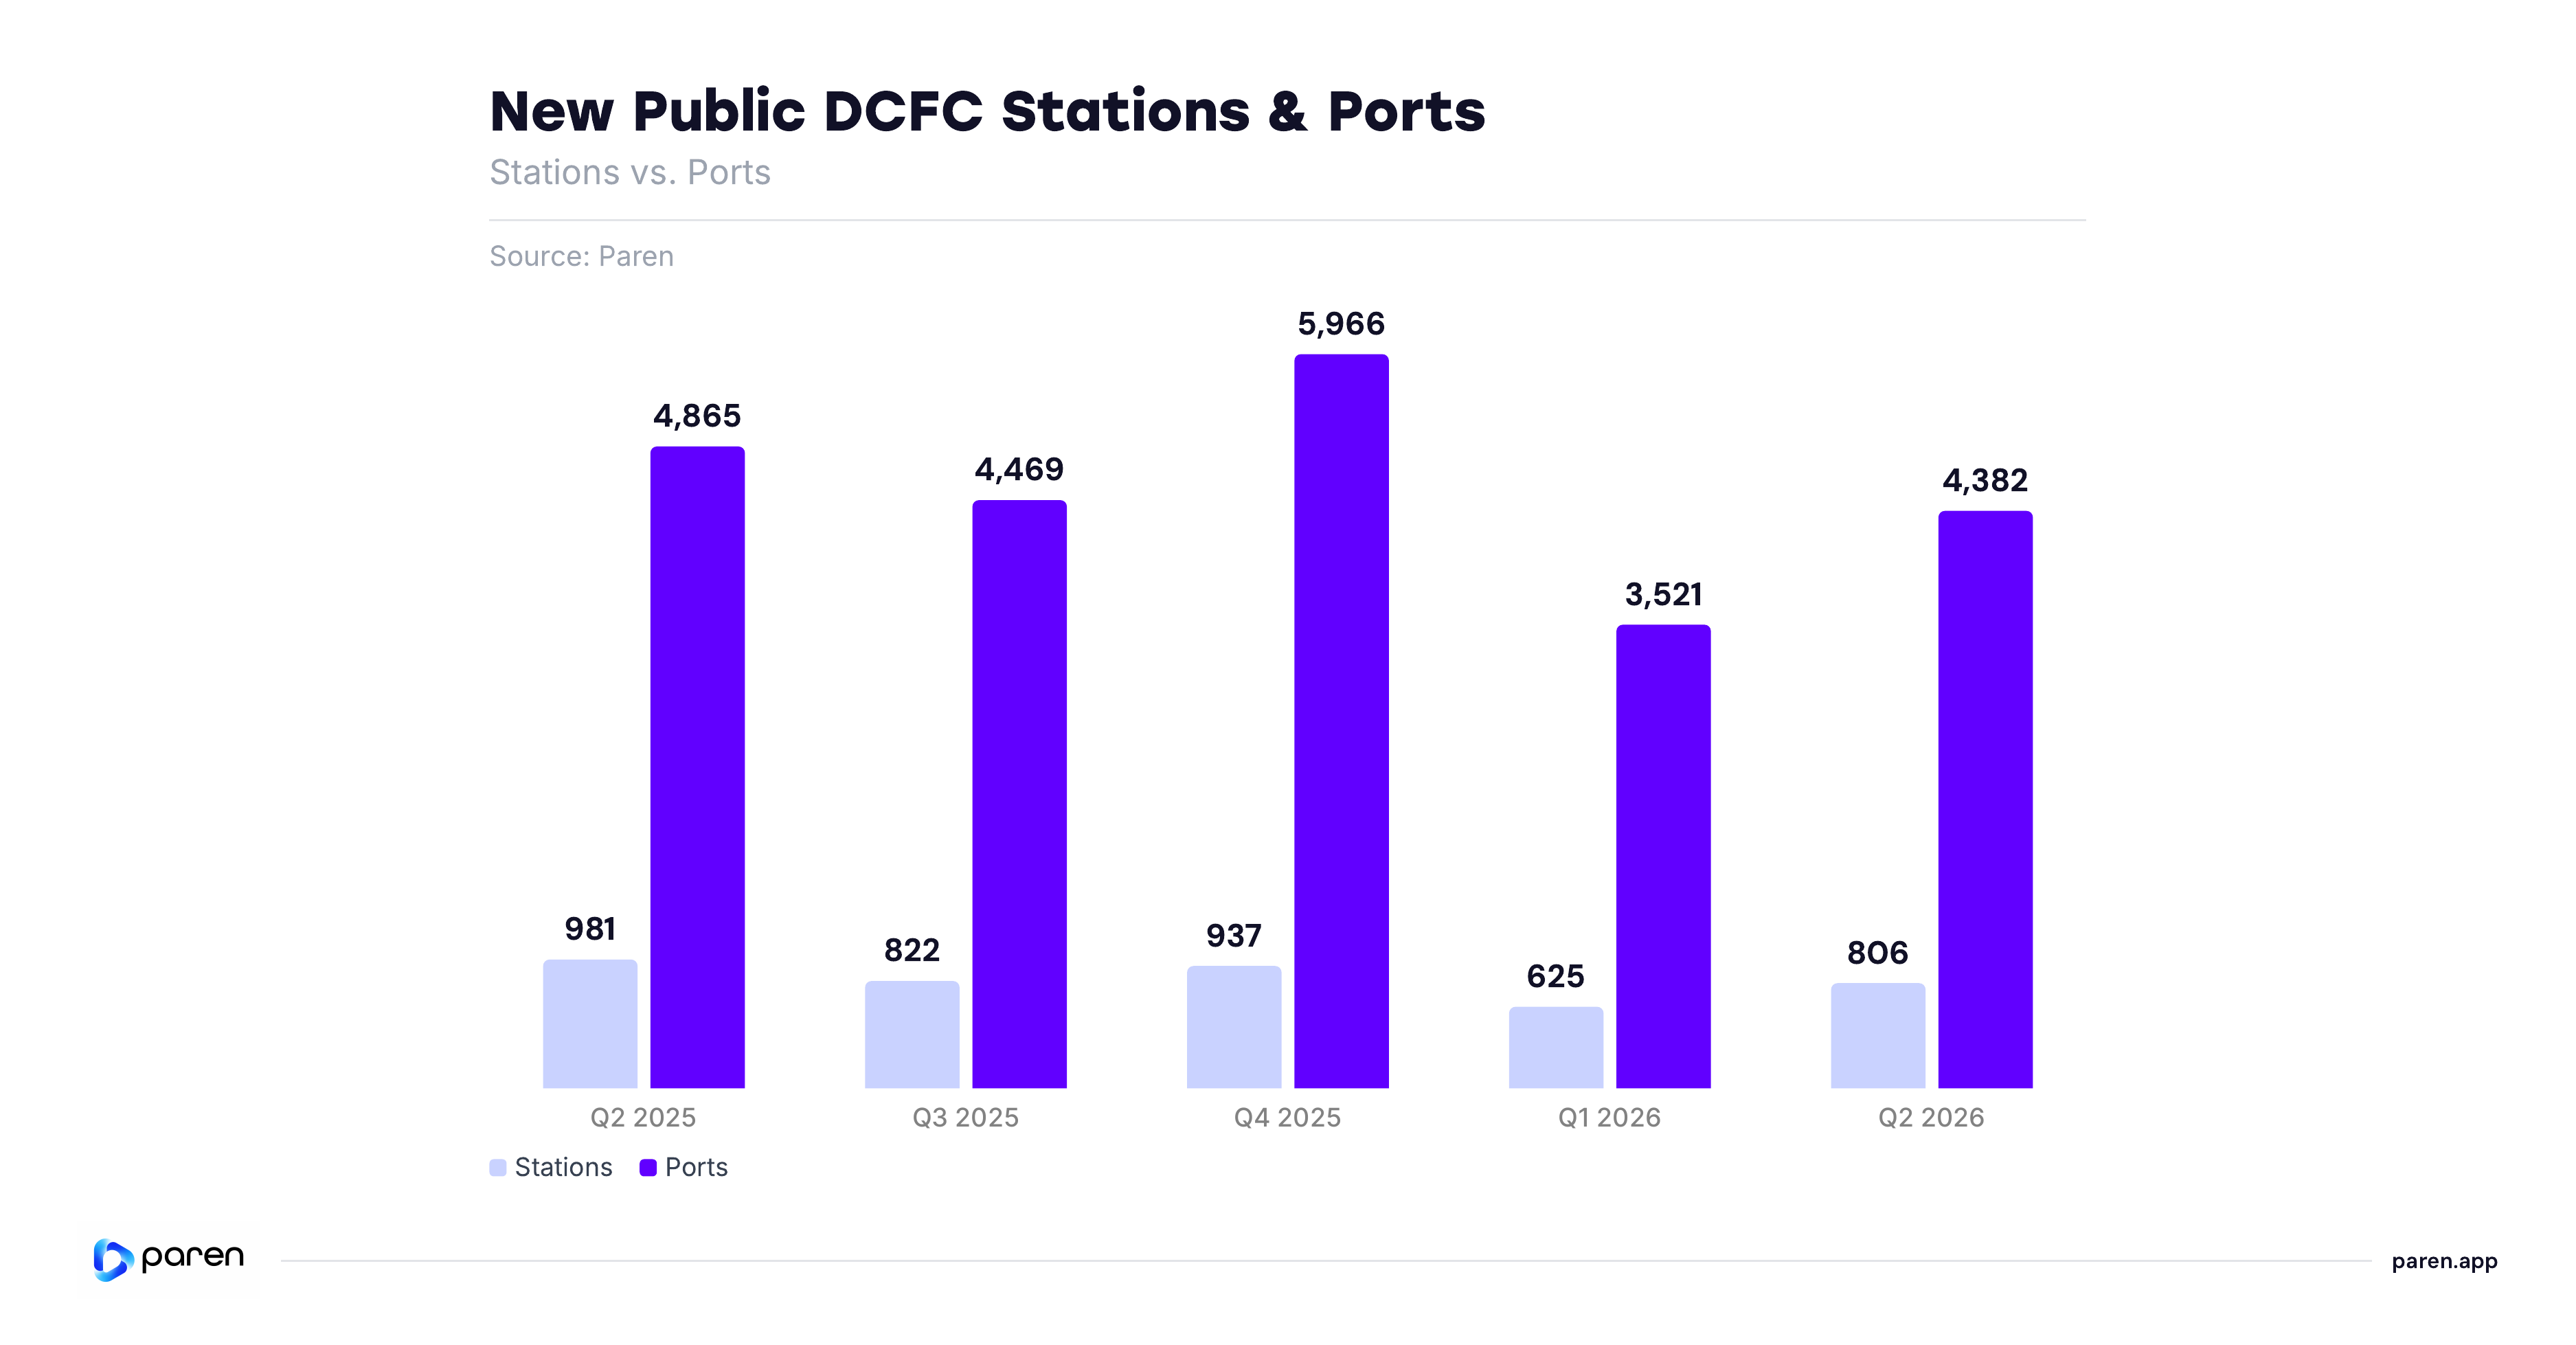
But from a business perspective, the signal is more mixed. The 4,382 new ports added in Q2 2026 was 10% lower than the 4,865 added in Q2 2025. Year to date, the 7,903 new ports added in 2026 is 7.4% lower than the 8,532 added in the first half of 2025. A two-quarter YoY decline is not definitive proof of a slowdown, but combined with recent CPO layoffs and pullbacks, it reinforces the industry's new mantra: operations, customer experience, and profitability.
The strong June YoY increase in sessions of 3.5 million (+29%) was a great sign for charging companies, but it is potentially concerning that sessions per port and utilization remained basically flat for the same period.
The industry is also entering a clear Charging 2.0 phase. Newer players such as Ionna, Walmart, Red E, Mercedes-Benz HPC, and Pilot Flying J are aggressively building national footprints, while Tesla, Electrify America, and EVgo are increasingly using a retail clustering strategy — adding stations within existing urban markets to capture more share of charge.
On connectors types, while several newer CPOs are adding a roughly 50-50 mix of CCS and NACS, much of the industry remains overweighted on CCS. As nearly every new EV now comes with a NACS port, CPOs that lag on NACS risk losing share to more NACS-centric competitors.
Reliability continues to improve driven primarily by the large volume of more reliable new ports being added. But for CPOs, reliability is now table stakes and does not drive high utilization, however, poor reliability will kill utilization.
Paren's SOTI report has become the industry leading barometer for the DC fast charging industry and the data in this Q2 2026 report underscores the maturation of the industry with a growing focus on reliability, customer experience, strategic growth — heading toward profitability.


Section 1: Charging Infrastructure Expansion
Deployment Steadies Off the Q1 Floor but Stays Below 2025's Peak Pace
DEPLOYMENT REBOUNDS OFF THE Q1 LOW
Operators opened 4,382 new ports across 806 new stations in Q2 2026, well above Q1's 3,521 ports and 625 stations — including a large deployment push registered at the 06-30 close. This is the first quarter of recovery after Q1's seasonal low, echoing the same soft-Q1-then-rebound pattern seen in the prior year.
THE PACE REMAINS UNDER 2025's HIGHS
Q2 2026's 4,382 new ports sit well below the 4,865 added in Q2 2025 and short of the 5,966-port Q4 2025 peak. The shape of the year is normalization: a high-water Q4, a Q1 reset, and a strong Q2 rebound.
NETWORKS BREAKDOWN
New-port deployment is broad across operators. Tesla led with 1,185 new ports (27.0% of the 4,382 quarter total), followed by Walmart (368), ChargePoint (333), and Red E (315); no other network topped ~5%.
Tesla's Site Density Eases While Non-Tesla Operators Keep Building Bigger
NON-TESLA NETWORKS CONTINUE TO ADD CAPACITY PER SITE
Average ports per station at non-Tesla networks reached 4.4 in Q2 2026, up from 3.6 a year earlier — a steady, multi-quarter climb as operators standardize on larger, multi-port sites. The figure eased slightly from the 4.8 Q4 2025 high but remains well above year-ago levels.
TESLA'S PER-SITE DENSITY HAS MODERATED
Tesla averaged 12.1 ports per station in Q2, down from 15.0 in Q2 2025, as its expansion has leaned toward adding new locations rather than continuing to enlarge existing ones.
TESLA STILL RUNS FAR DENSER SITES
Tesla averaged 12.1 ports per station in Q2 versus 4.4 at non-Tesla networks — roughly a 2.7x difference. The two are moving on separate tracks: non-Tesla operators are standardizing on larger multi-port sites, while Tesla is adding new locations rather than enlarging existing ones.

Tesla's All-Time Share Falls Below 50% for the First Time
TESLA'S GRIP LOOSENING
Tesla added 1,185 new ports in Q2 2026, 27.0% of the quarter's 4,382 total, well below its ~50% share of the all-time active base. Its grip on incremental supply continues to loosen.
GROWTH BROADLY DISTRIBUTED
The next several networks together added well more than Tesla alone. Walmart (368), ChargePoint (333) and Red E (315) each cleared 300 new ports, with single-Tesla operator above 8.4%. Networks outside the top 10 collectively added 1,217 new ports — 27.8% of the quarter's total, more than any single named operator except Tesla.
FAST RISERS RESHAPING RANKS
Newer entrants scaled fastest relative to their footprint — Walmart (8.4% of Q2 new ports vs 0.8% all-time), Red E (7.2% vs 2.5%), and Ionna (4.2% vs 1.5%) and Mercedes-Benz HPC (2.7% vs 1.1%) all punched well above their installed base, alongside newcomers like Pilot Flying J (3.3% of Q2 new ports vs 1.6% all-time).

Q2 2026's 806 New Stations Spread Nationwide, Led by California, Texas and Florida
SPREAD NATIONWIDE
The Q2 buildout was national, not concentrated in a few metros. Operators brought 806 new public fast-charging stations online across nearly every state in Q2 2026. California led by a wide margin — roughly 120 new stations — followed by Texas, Florida, Illinois and New York, with South Carolina, Washington, Pennsylvania and Michigan each adding around 30. The footprint mirrors where demand and the installed base are deepest — coastal metros, Texas, the industrial Midwest and the Southeast.
SKEWS URBAN
The new sites skew urban. Roughly four in five of the new stations sit in urban areas, versus about one in five rural — operators are still prioritizing dense, high-traffic corridors where utilization runs highest. The rural share reflects steady fill-in along interstates and secondary markets rather than a move away from cities.
BROAD-BASED GROWTH
Growth is broad across operators, too. The new stations come from any single builder (see the leaderboard), so the quarter's expansion was broad-based on both geography and operator. Capacity keeps following demand into populated corridors — consistent with utilization holding steady even as the base expands.

High Power Is Now the Default — 250 kW+ Captures the Majority of New Ports
HIGH POWER DEFINES NEW BUILDS
Among non-Tesla networks, ~62% of new Q2 2026 ports were 250 kW+, up from 39% a year earlier, while the sub-150 kW share fell to ~20% from 33%. The mid-band (150–249 kW) eased to ~18%.
250 kW+ IS THE STANDARD
Including Tesla, ~72% of the quarter's new ports were 250 kW and just ~14% were sub-150 kW — confirming high power as the industry default rather than a single-segment trend.
LOW-POWER NOW PURPOSE-SPECIFIC
The 24–149 kW band (623 ports) reflects targeted urban and fleet-adjacent siting rather than a reversal of the high-power trend; vehicle capability, not charger capability, is now the binding constraint.

NACS Has Roughly Doubled Its Share of New Builds; the Installed Base Is Still CCS-Dominated
NACS SHARE HAS DOUBLED
NACS reached 22.9% of new non-Tesla connectors in Q2 2026 (800 ports), up from ~10% in Q2 2025 — broadly in line with Q1 2026 (22.5%), as more operators add the standard alongside CCS.
GROWTH ADDITIVE, NOT CONVERGING
CCS still accounted for 70.8% of new non-Tesla connectors in Q2 (2,471) and CHAdeMO for 6.3% (220). Operators are layering NACS onto CCS-first builds rather than switching.
INSTALLED BASE STILL TRAILS
Across the broader non-Tesla DCFC base of 48,371 ports, CCS holds 74.6%, CHAdeMO 17.4%, and NACS just 8.0%. Even at the current new-build pace, parity is years away — mixed-connector infrastructure and adapters will define near-term access.

Section 2: Utilization & Reliability
Utilization Holds in a Narrow Band as the Charging Base Keeps Expanding
UTILIZATION HOLDS GENERALLY CONSISTENT ACROSS FIVE QUARTERS
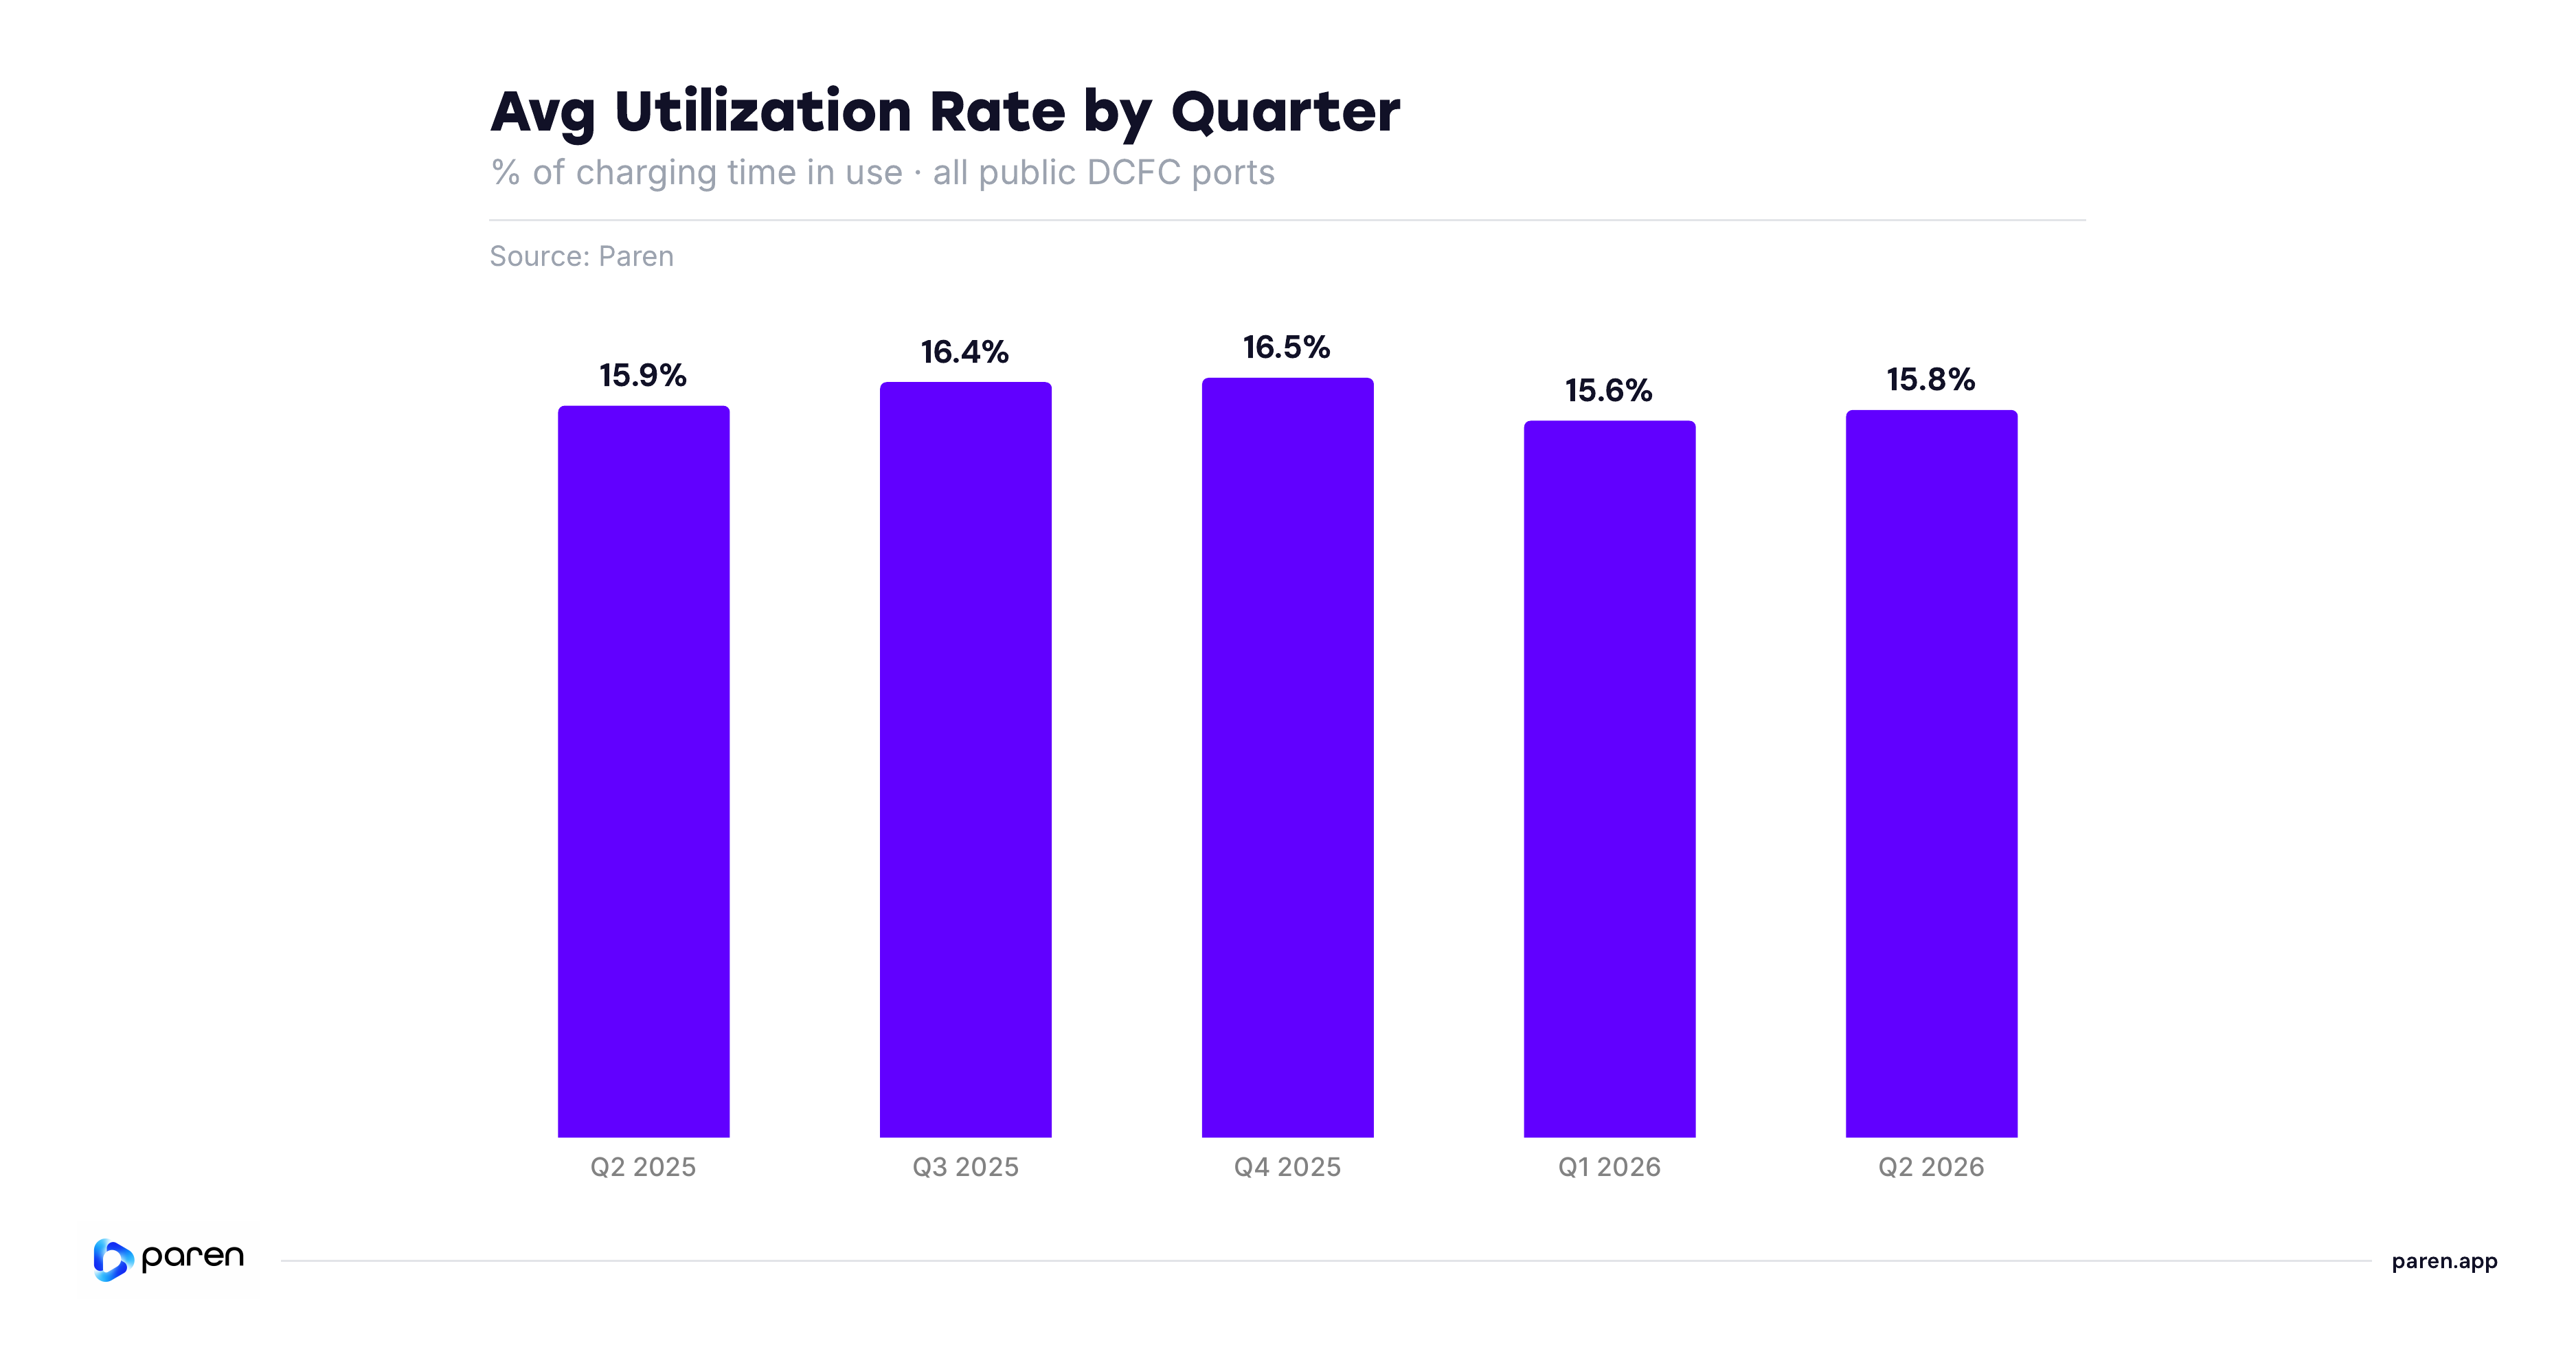
The national average has moved within a roughly 0.85-point band, from a 16.49% high in Q4 2025 to a 15.64% low in Q1 2026, with full-quarter Q2 2026 at 15.76%. Over the same window station count grew sharply — up 16.4% — yet the utilization rate held steady. Drivers are filling up the new capacity roughly as fast as it's being built, not falling behind it.
Utilization Concentrates in Dense, High-Demand Markets While Rural States Trail
HIGH-DEMAND LEADERS
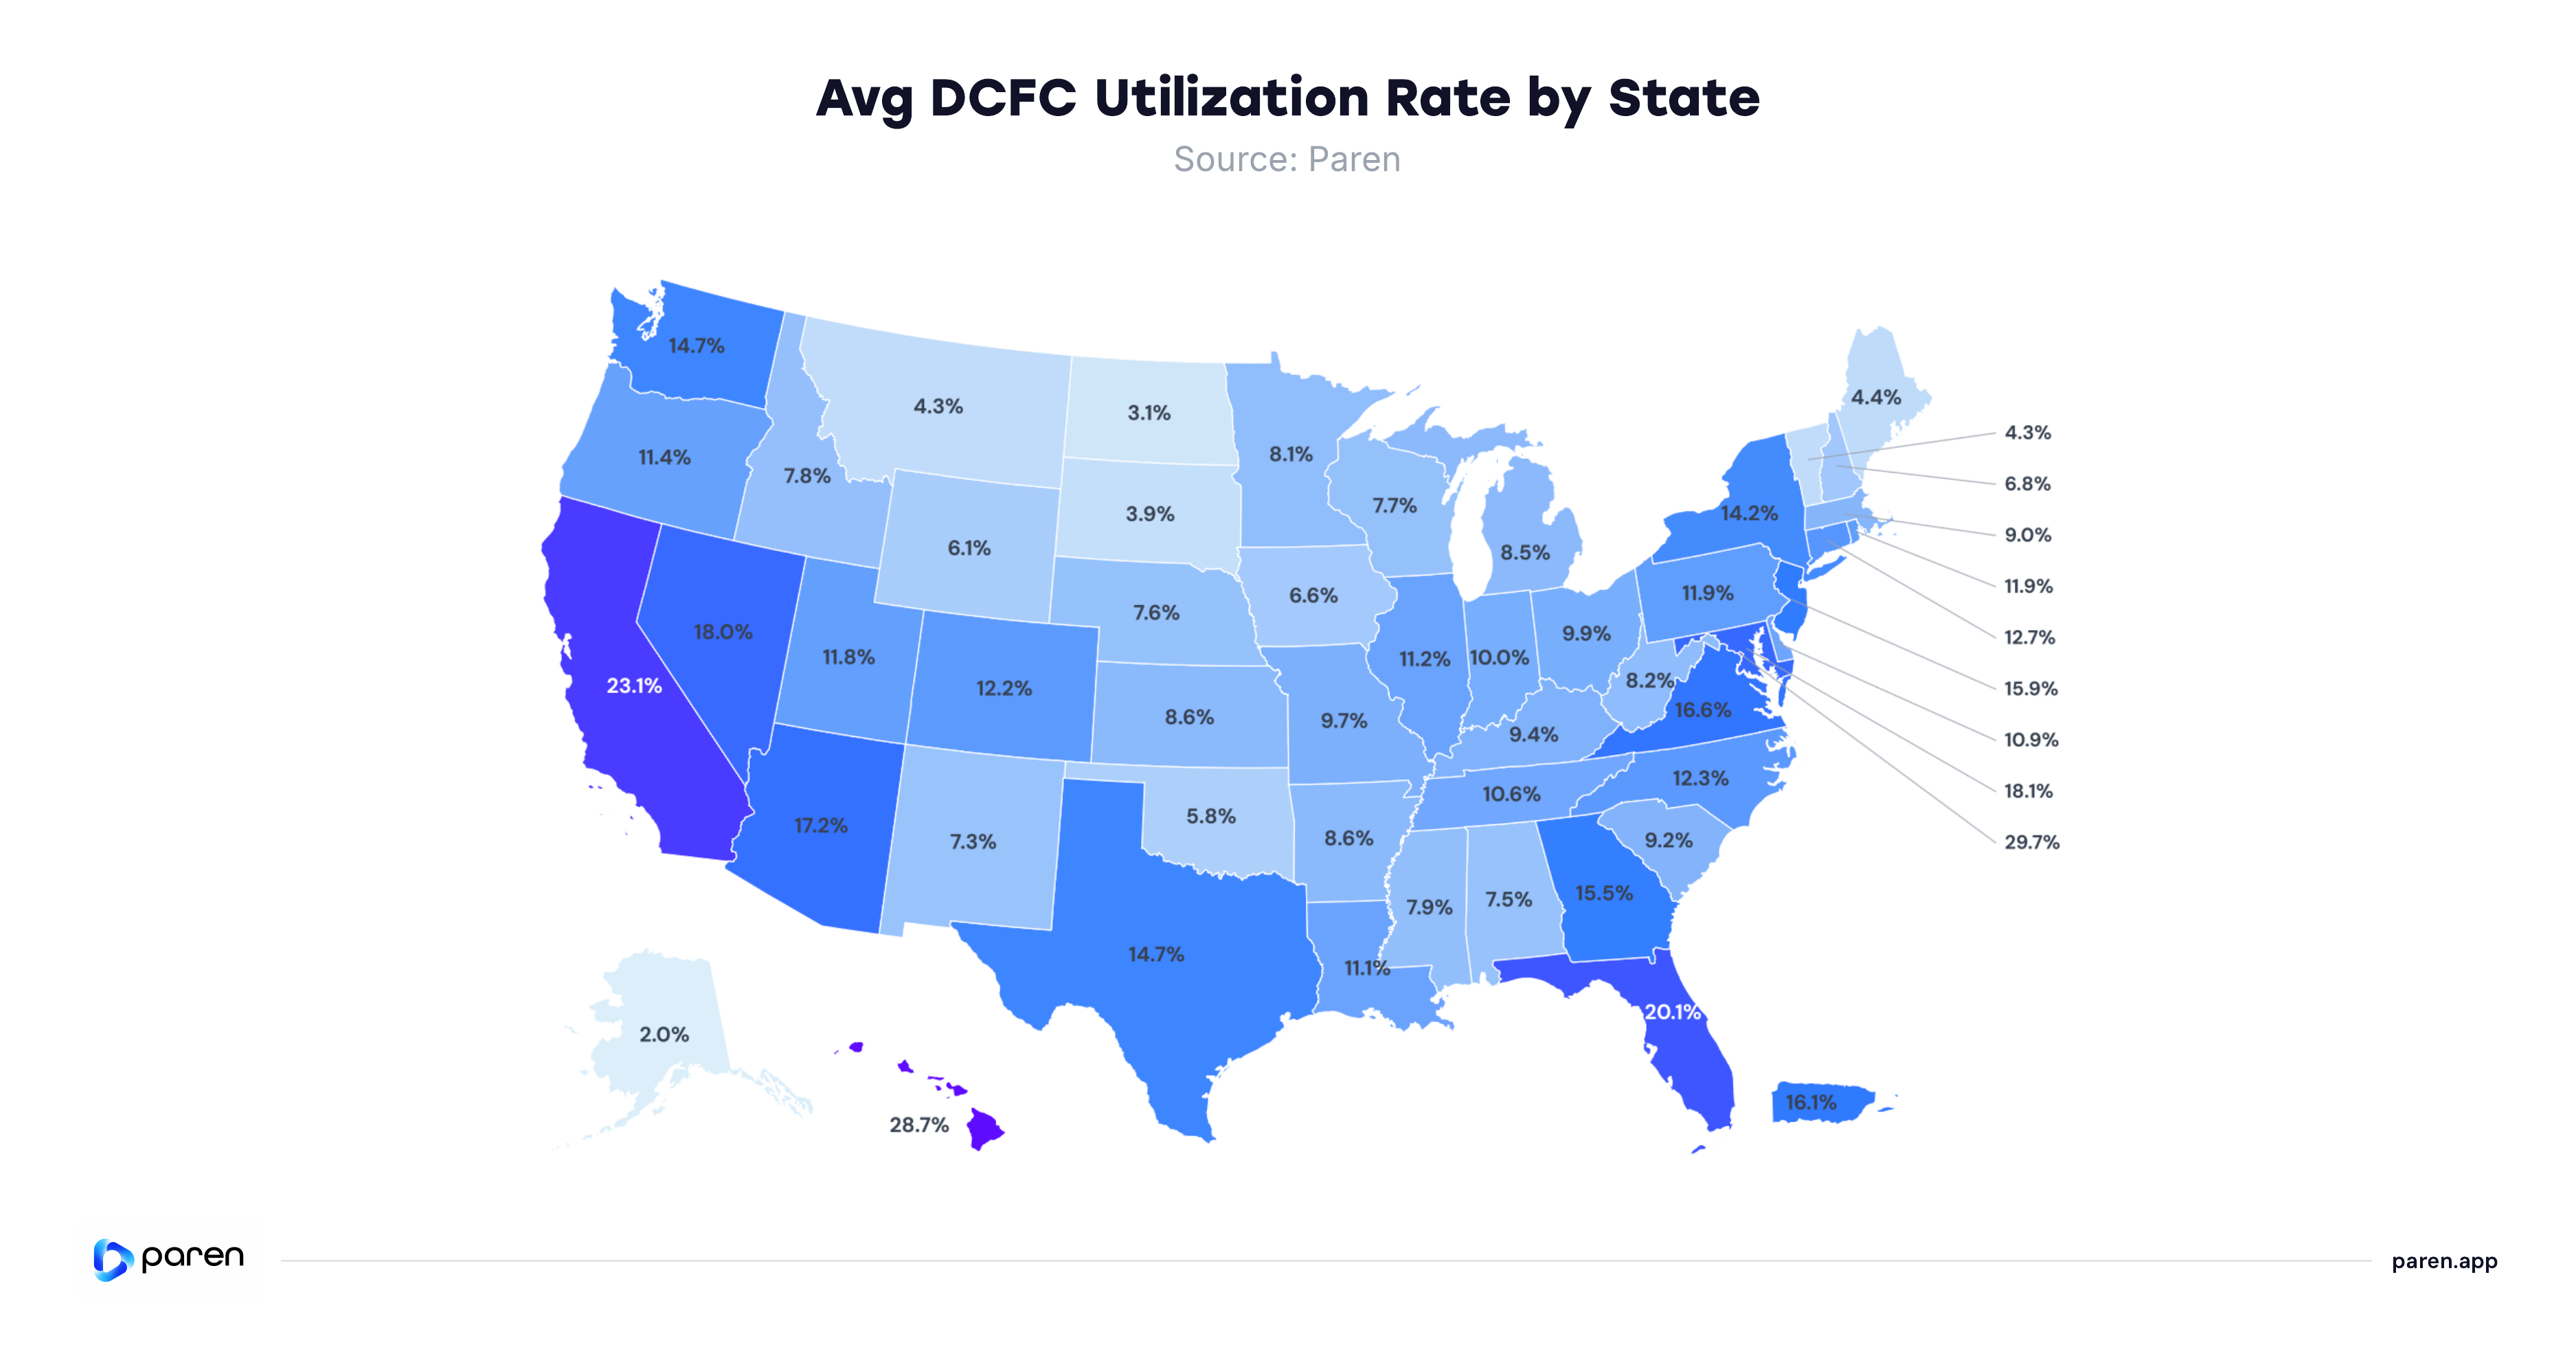
The District of Columbia (29.7%), Hawaii (28.7%) and California (23.1%) post the highest utilization, followed by Florida (20.1%), Maryland (18.1%), Nevada (18.0%) and Arizona (17.2%). California pairs a top-tier rate with by far the largest footprint (17,374 ports).
LOW-DENSITY STATES TRAIL
Alaska (2.0%), North Dakota (3.1%), South Dakota (3.9%), Montana (4.3%) and Vermont (4.3%) record the lowest utilization, consistent with thinner demand across smaller charging populations.
UNEVEN YEAR-OVER-YEAR SHIFT
In Q2 2025, national utilization slipped from 15.9% to 15.8%. Gains concentrated in smaller markets climbing off low bases — Hawaii rose the most, up 4.6 points to 28.7% — while several large, mature markets softened as added capacity outran demand.
Sessions per Port Recovers Through Spring as Volume Climbs Past 16 Million a Month
SPRING AHEAD OF Q1
Total monthly session volume climbed from 14.1 million in April to 15.76 million in May and 16.1 million in June 2026 — the quarter's high — with sessions per port rising from 202.9 in April to 222.9 in May and 224.7 in June.
GROWTH TRACKS SUPPLY
The recovery lines up with utilization holding essentially flat — 15.8% in Q2 versus 15.6% in Q1 and 15.9% a year ago. More sessions land on a port base that keeps expanding, so throughput per port recovers seasonally while the utilization rate stays range-bound — demand is growing roughly in line with capacity, not ahead of it.

Reliability Clusters in the Mid-90s, With Oklahoma a Clear Outlier
TIGHTLY GROUPED
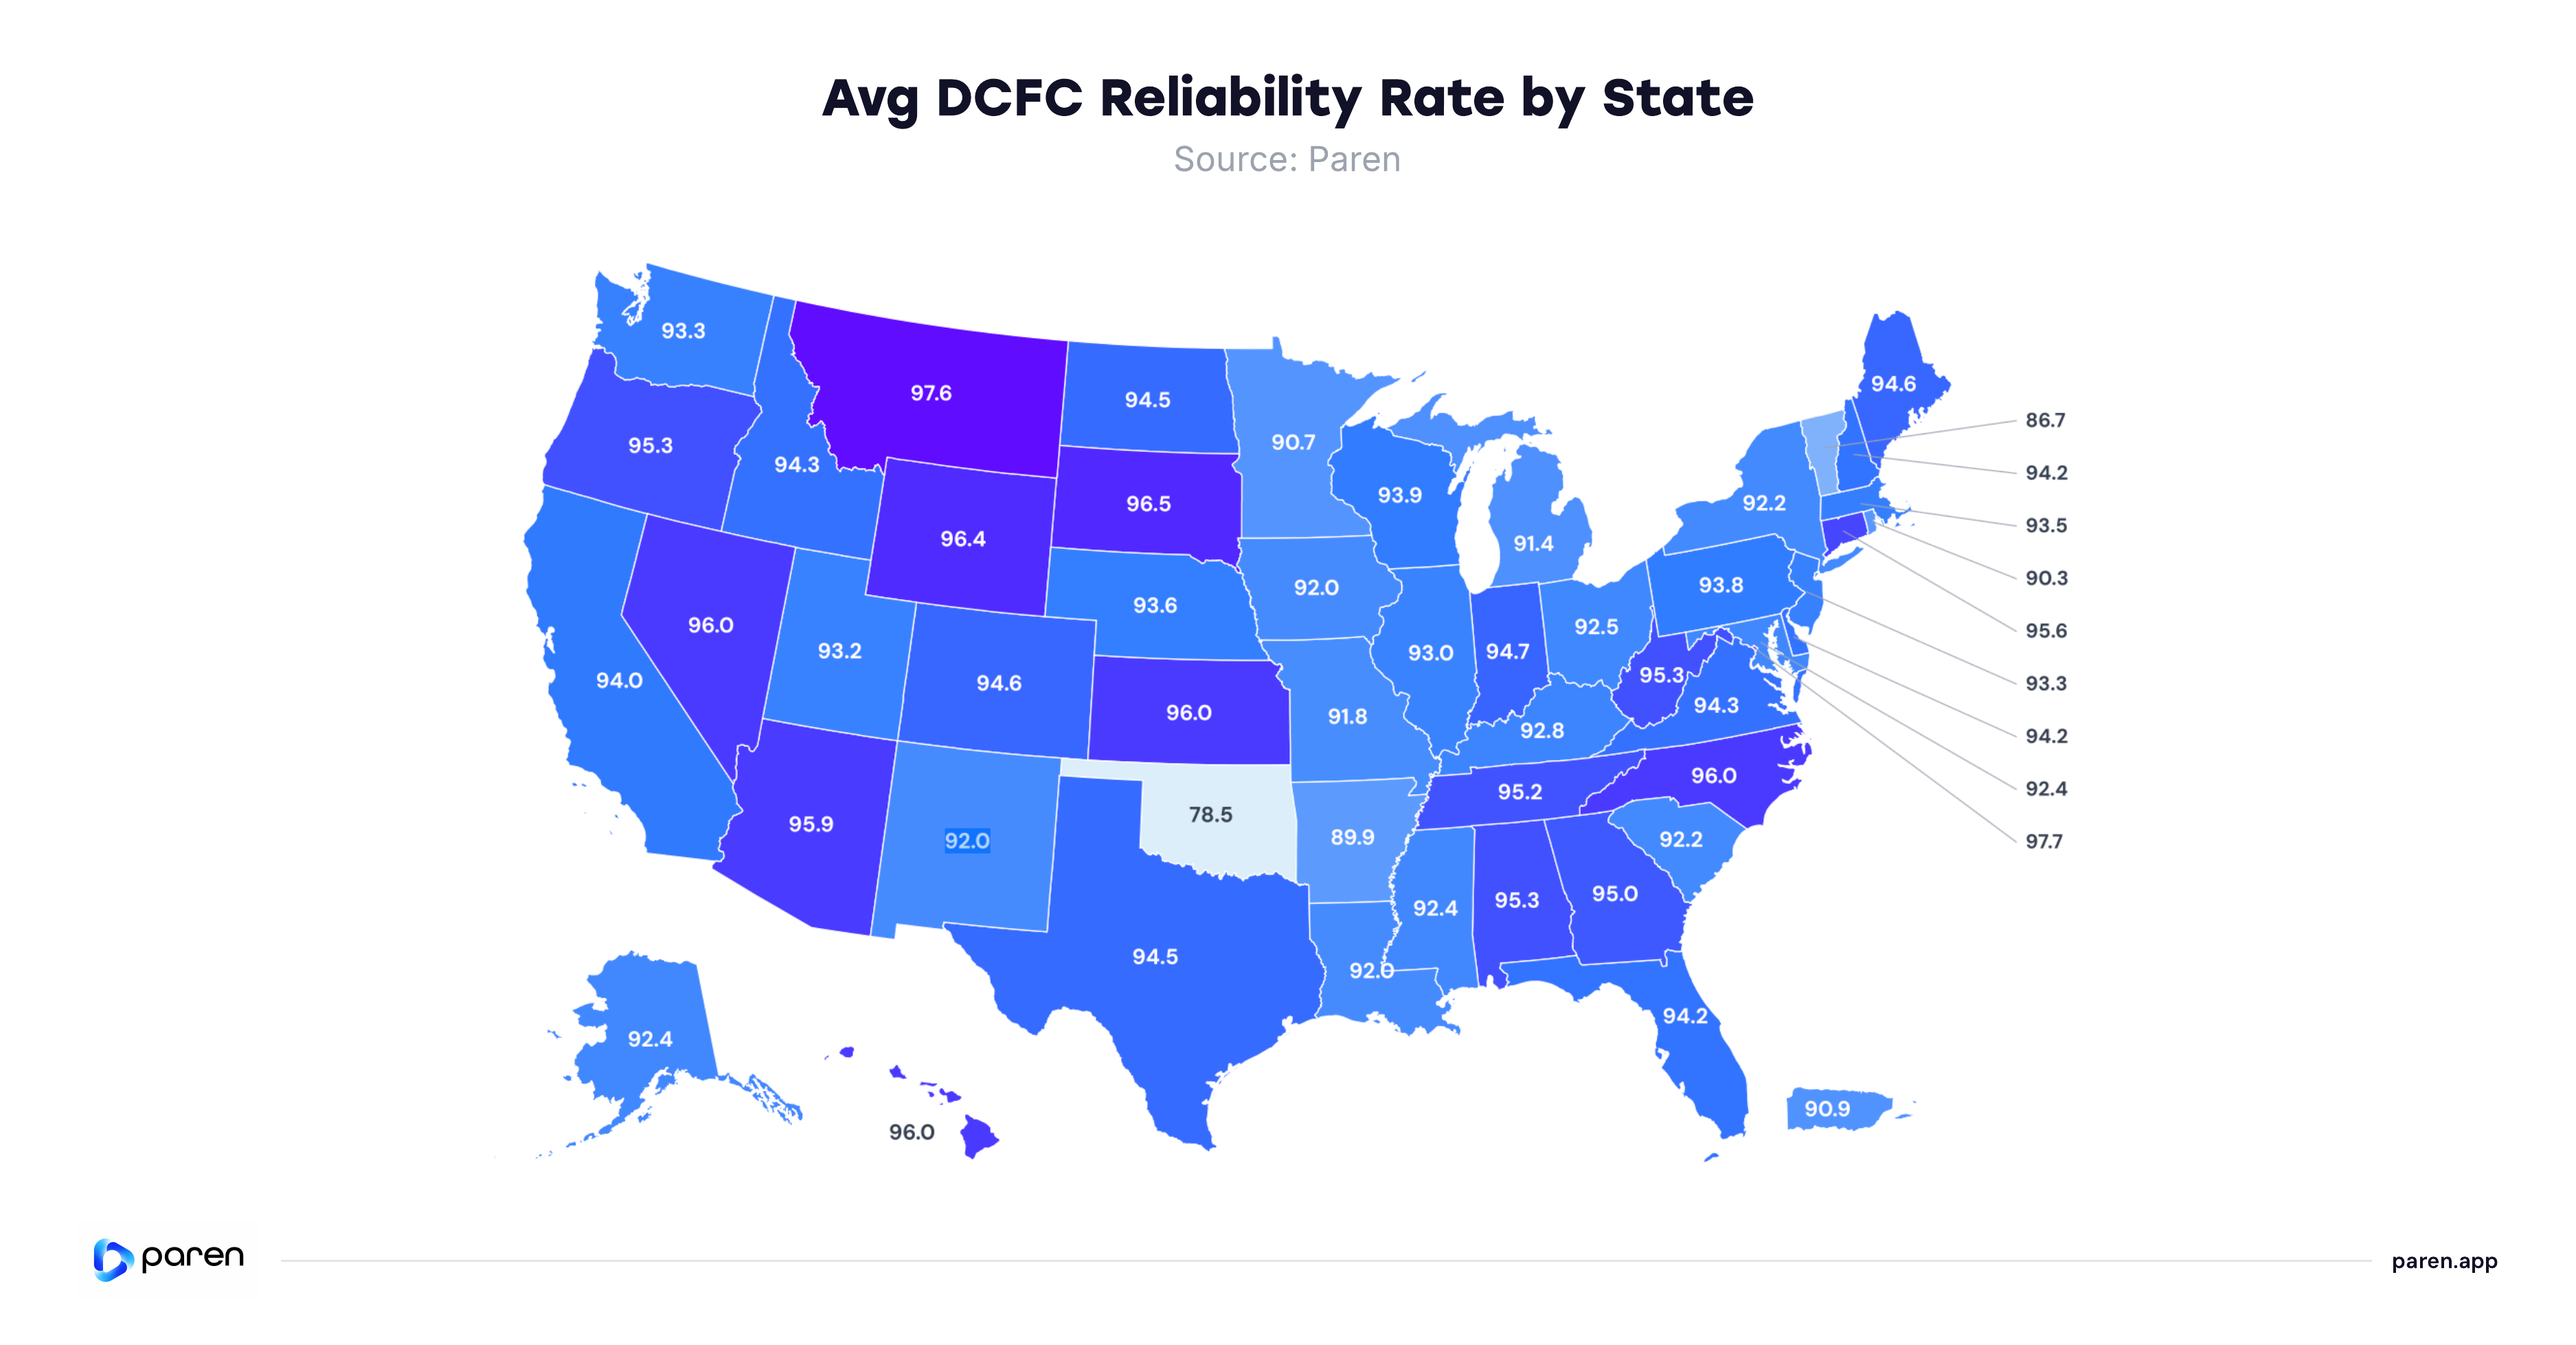
Measured as the reliability rate, most geographies fall in the low-to-mid 90s. The District of Columbia (97.7), Montana (97.6), and South Dakota (96.5) lead, with Wyoming (96.4), Kansas (96.1), North Carolina (96.0), and Nevada (96.0) close behind.
OUTSIDE THE PACK
Oklahoma records 78.5, more than eight points below the next-lowest geography. Vermont (86.7) and Arkansas (89.9) are the only others under 90, followed by Rhode Island (90.3), Minnesota (90.7), and Puerto Rico (90.9).
FEWER LOW OUTLIERS
The number of geographies scoring under 90 on reliability fell from 8 to 3 year-over-year. Oklahoma remained the clear low outlier, though it improved from 73.6 to 78.5; Vermont and Arkansas were the only other two still under 90. Five states crossed above 90 in the same period — Alaska, Iowa, Maryland, South Carolina and Delaware.
Fixed Thresholds Reveal Two Small Extremes and One Dominant Middle Group
TWO SMALL EXTREMES, ONE DOMINANT MIDDLE.
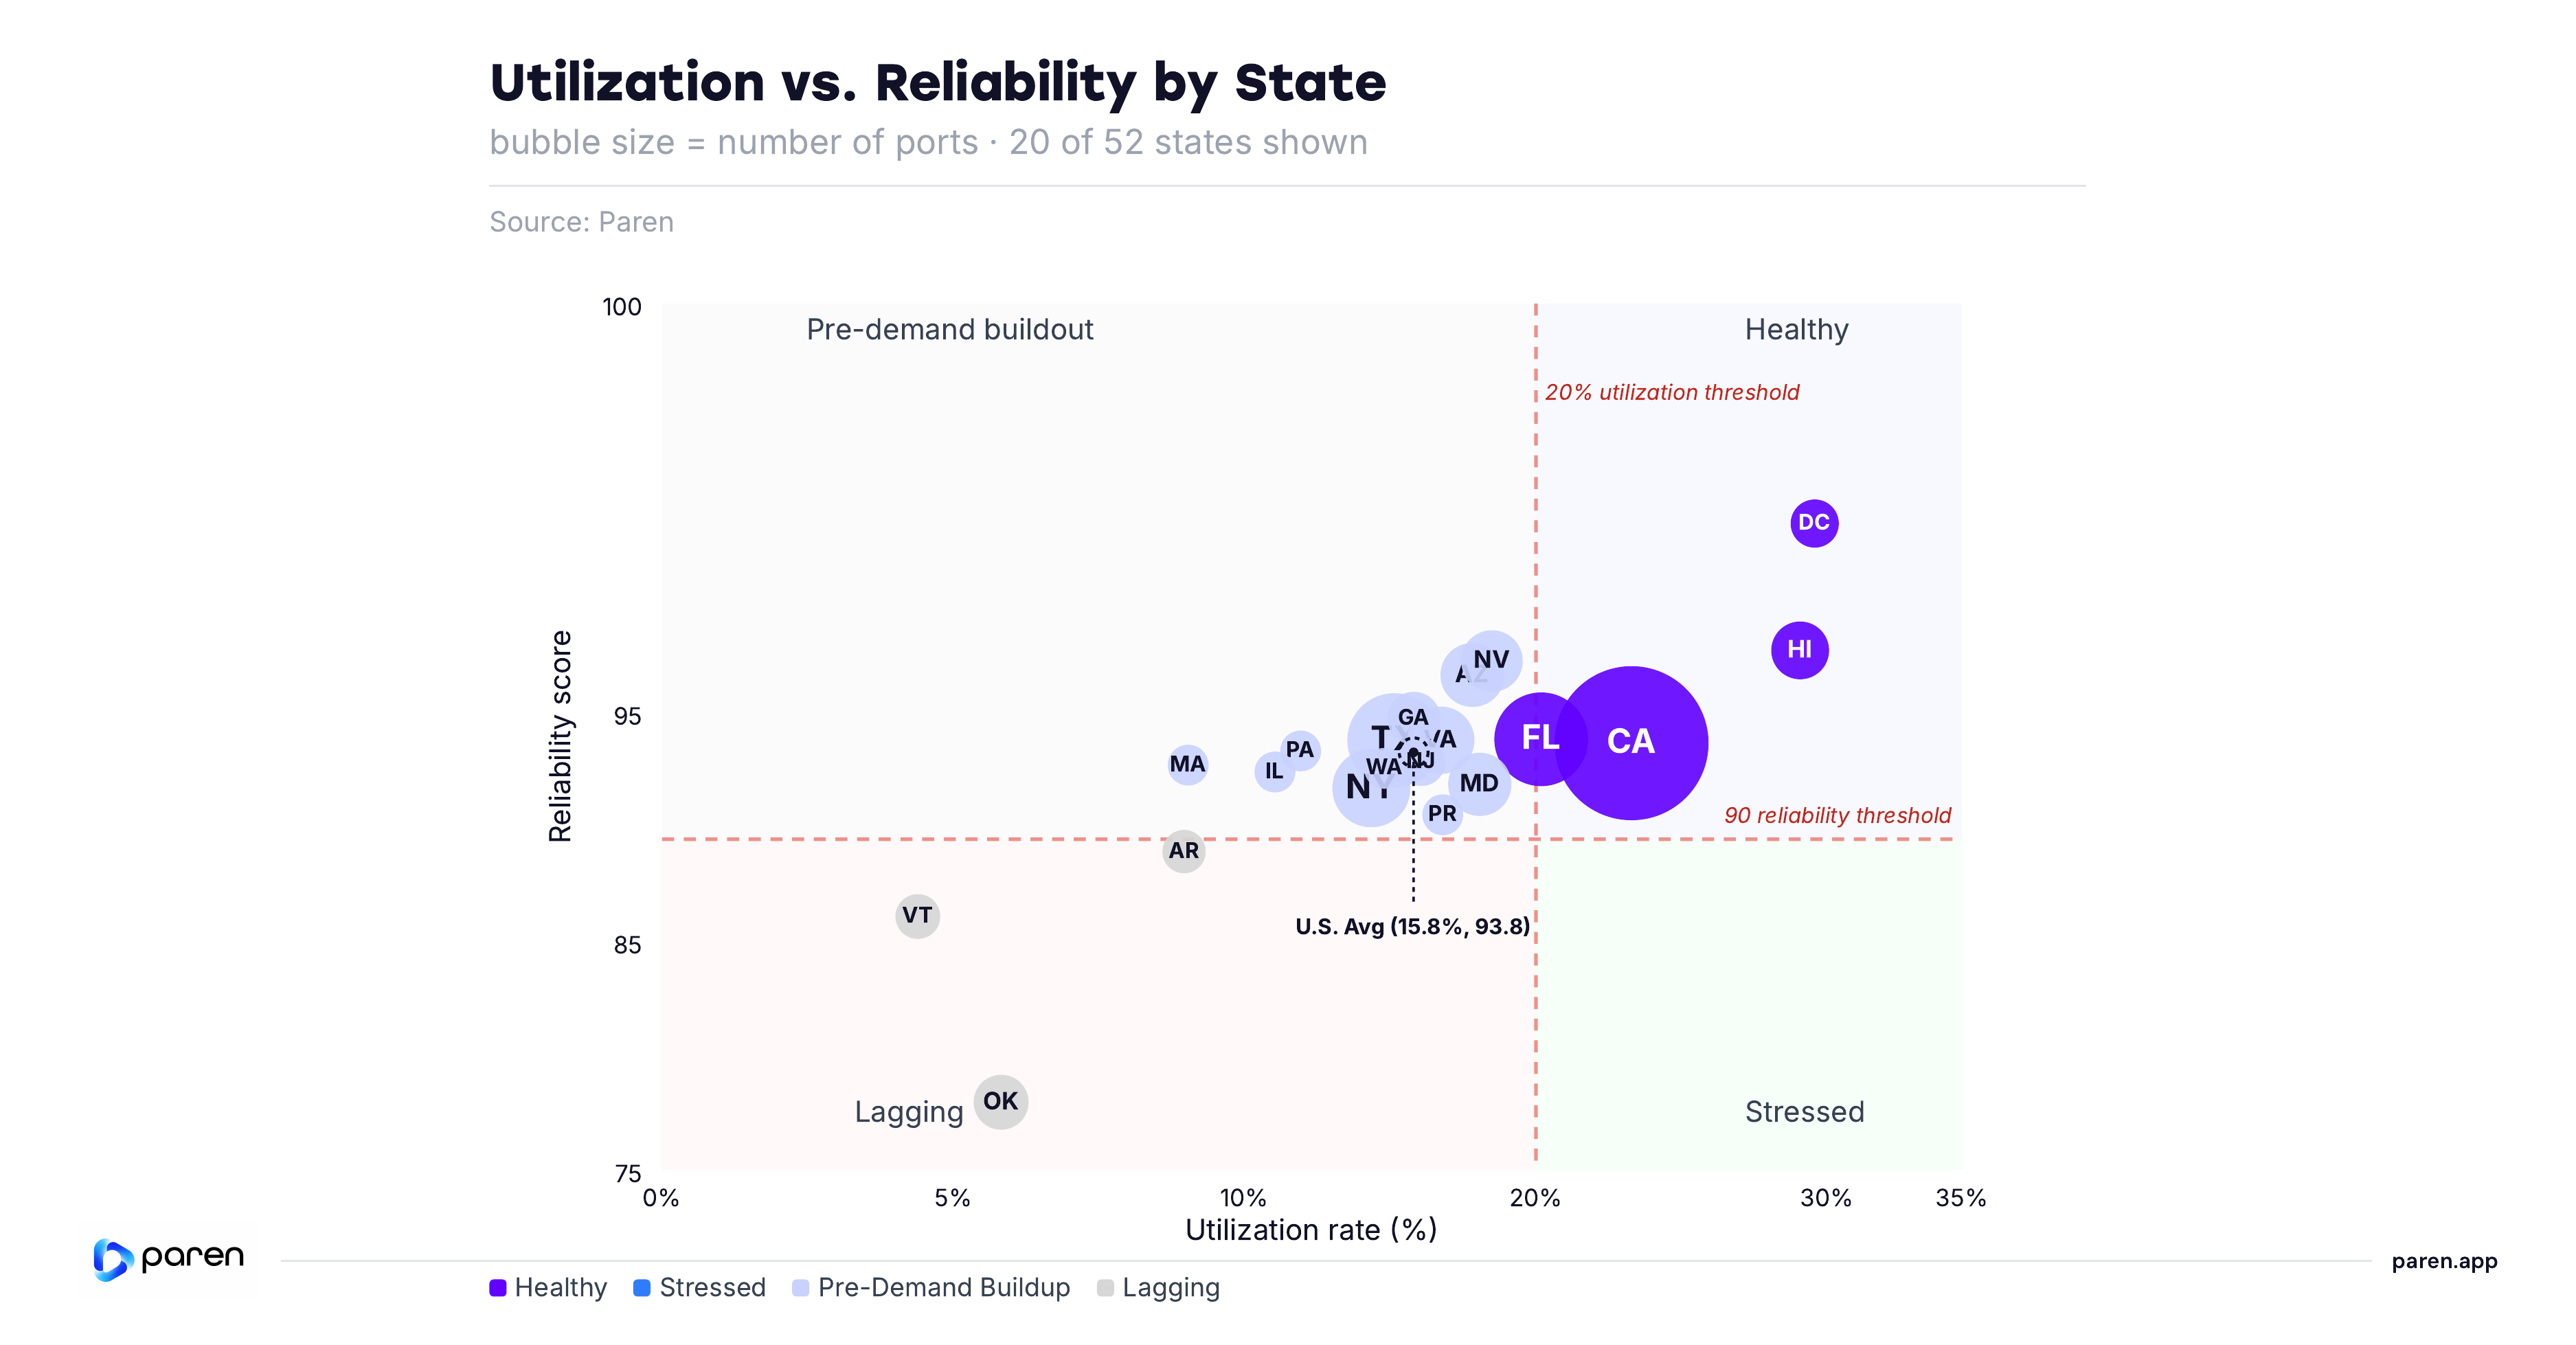
Of 52 states and territories, only four land in Healthy — DC, Hawaii, California and Florida — and three in Lagging: Oklahoma, Vermont and Arkansas. The remaining 45 (86.5%) sit in Pre-demand Buildout: strong reliability, utilization under 20%. The chart shows 20 representative states — the 7 extremes plus key markets.
STRESSED IS EMPTY.
No state combines high utilization with weak reliability — every state above 20% utilization also clears 90 reliability, and vice versa.
NEAR-HEALTHY TIER.
Nevada (18.0%), Maryland (18.1%), Arizona (17.2%), Virginia (16.6%), and Puerto Rico (16.1%) are closest to crossing into Healthy — worth watching, since only closing real utilization ground gets them there.
PRICE DOESN'T SORT IT.
Healthy states span a wide price range ($0.51–$0.86), and Oklahoma — the least reliable state — still prices above the $0.538 national average.
Section 3: EV Charging Pricing
Average Prices Held Largely Stable in Q2 2026, With Supply-Constrained States at the Top
PRICES STAYED CLUSTERED
State-level prices stayed clustered, with a national average of $0.538 per kWh.
CONSTRAINED MARKETS LEAD
Hawaii ($0.856 per kWh) remains by far the most expensive, more than $0.20 above the next-highest state. New Jersey ($0.651) is a distant second, followed by Maine ($0.634) and Washington D.C. ($0.631) — likely reflecting higher-load demand in dense and constrained regions. California and Connecticut round out the top of the range, tied at $0.606.
PLAINS STATES CHEAPEST
Nebraska ($0.428) and Iowa ($0.442) are the least expensive in the country, followed by Missouri ($0.460), North Dakota ($0.465) and South Dakota ($0.472) — lower-density, lower-utilization markets where simpler fixed pricing keeps rates close to cost. Demand looks largely inelastic at current utilization levels; price responsiveness may become more visible as time-of-use adoption expands.

Fixed Pricing Remains the Norm, but Large Markets Are Splitting Toward Time-of-Use
FIXED STILL LEADS
Fixed per-kWh pricing accounted for 70.7% of qualifying stations at the Q2 2026 close, with time-of-use at 27.0% and per-minute billing at 2.3%.
LARGE MARKETS SHIFT TO TOU
California (45.3%), Maryland (39.9%), Virginia (39.8%) and Nevada (39.2%) show by far the highest time-of-use adoption — each with less than 60% of stations still on fixed rates, a sharp departure from the near-universal fixed pricing seen in smaller states. Wyoming pairs a high 90.6% fixed-pricing share with just 3.1% time-of-use — but 6.2% per-minute billing, the highest share among the states shown, with Montana close behind at 5.4%.

Section 4: Appendices
Appendix A: Terminology
Charging Infrastructure
CPO — Charge Point Operator
Fast Charging — Charging port of a minimum of 24 kW
NACS — North American Charging Standard; Tesla's charging connector now adopted by many networks.
NEVI — National Electric Vehicle Infrastructure program under the Bipartisan Infrastructure Law.
Connector — A charging plug conforming to CCS, CHAdeMO, or NACS (J3400) standard
Port — A charging unit with one or more connectors capable of charging one EV.
Station — A physical location with one or more EVSEs (charging ports).
Utilization & Reliability
Reliability Index — The Paren-specific calculation that measures charger reliability taking into account recent successful charge sessions with and without retries, failed charge attempts, and station downtime over a specific time period.
Tesla — Tesla is a reference to the Tesla Superchargers
Utilization — The percentage of tracked time spent on both successful and unsuccessful charging activity at a charger over the time period open per day.
EV Charging Pricing
Fixed Price — Refers to a consistent rate per kWh for the entire charging day.
Time-of-Use (TOU) — Pricing changes based on the time of day with higher prices during expected peak demand time. It encourages off-peak charging and can help balance grid demand.
Dynamic Pricing — Pricing changes based on an ad-hoc changes not tied to a specific time. Typically, dynamic pricing daily spreads are within the same minimum and maximum of the TOU model.
Time — Charges by the minute or hour. Often used where energy-based pricing is restricted.
Appendix B: Methodology
Changes in 2026
Continuous Refinement: We introduced targeted refinements to improve accuracy and better reflect real-world market conditions. Some figures may differ slightly from earlier editions. Most notably, in Q2 2026, our session counting methodology improved across busy charging stations, resulting in more tracked, successful charging sessions.
Infrastructure Methodology: We enhanced how we measure station growth and identify new stations, reducing reliance on AFDC open-date fields and incorporating additional signals for more accurate activation timing.
Pricing Methodology: We updated our average pricing model to exclude free chargers from calculations to reduce distortion. Prior-quarter figures were recalculated using this updated methodology for comparability.
Port-Count Universes: Port counts vary by analysis because the report uses different validated data universes. Network-size figures use Paren's reconciled installed DCFC port base. CPO market-share tables use the subset of installed ports that can be attributed to a charging network/operator. Sessions, utilization and reliability use ports within Paren's real-time observed coverage for the reporting period.
These totals answer different questions and should not be read as competing counts. Installed-base figures describe network scale; operator-attributed figures support leaderboard and market-share analysis; observed-coverage figures support performance metrics such as sessions per port, utilization and reliability.
Appendix C: Data Sources
- Paren Public Charging Infrastructure Dataset
- AFDC
- Select NEVI RFP documents and award data
- Proprietary charging session / utilization model
Report Team



Paren is regularly featured in leading news outlets such as The Wall Street Journal, The Washington Post and The New York Times, as well as industry-specialized outlets such as Electrek and InsideEVs.
Read More ↗
Want the data behind the data?
Access utilization, reliability, and pricing at the station level across 95%+ of US and Canadian DCFC infrastructure.