Canadian EV Fast Charging — Q4 2025
2025 marked an inflection point for Canada’s DC fast-charging network.
Even as EV sales slowed, charging infrastructure continued to expand nationwide, utilization strengthened in leading markets, pricing varied widely across provinces, and reliability remained consistently high. This report examines how Canada’s fast-charging ecosystem scaled and evolved over the full year — and what it signals for the next phase of growth.

Introduction
Paren was established in 2024 to build a comprehensive, neutral data platform focused on electric vehicle charging infrastructure. In 2025, we launched our quarterly State of the Industry report for the U.S. market, delivering a structured, data-driven perspective on network performance and market evolution.
This report extends that analytical framework to Canada, examining how the network evolved in 2025 across deployment, utilization, pricing, and reliability — core indicators of whether infrastructure is scaling sustainably across a geographically and operationally complex market.
Paren processes over 100 million data events daily and, since Q2 2025, has tracked more than 80% of all public DC fast-charging sessions in Canada, providing a nationally representative dataset for this analysis. Our cross-border coverage enables consistent benchmarking while accounting for Canada’s distinct regulatory and geographic context.
The following executive summary highlights the key structural trends shaping Canada’s fast-charging ecosystem in 2025.
The Paren Team
Report Overview & Highlights - Q4 2025
2025 marked a scaling year for Canada’s fast-charging network, even amid a decline in EV sales.
Despite a more cautious adoption environment, infrastructure expanded, utilization increased, and reliability remained strong.
Infrastructure expanded +28% YoY
Canada added 1,925 new DCFC ports in 2025 (+28% YoY), reaching 8,804 total ports. Deployment remained concentrated in British Columbia, Quebec, and Ontario — Canada’s highest EV adoption and utilization markets — while expansion also broadened national corridor coverage in the Prairies and Atlantic Canada.
Demand growth kept pace with capacity
Utilization rose from Q3 to Q4, confirming that new capacity was absorbed. At the CMA level, several large metros are approaching capacity pressure, signaling a shift from coverage buildout to densification in leading markets. Lower sessions-per-port in less-populated provinces primarily reflect geography-driven corridor buildout rather than weak demand.
Fast-charging prices vary widely across provinces
While the national average was $0.42/kWh in Q4, provincial prices ranged from below $0.40/kWh to $0.65/kWh — reflecting structural differences in electricity regulation, demand charges, and utility involvement.
Reliability remained strong nationwide
Reliability score exceeded 90 in most provinces driven by new deployments and upgrades. High-demand markets showed slightly lower scores, underscoring the operational complexity of maintaining uptime as utilization intensifies.
Review the following pages for in-depth analysis of these trends. For even deeper insights, please reach out to us at hello@paren.app for a demo, conversation, or general Q&A.
2025 confirmed that Canada’s fast-charging market is scaling — but not yet saturated
• Deployment grew +28% YoY
• Demand absorbed new capacity
• Prices vary significantly per province
• Reliability remained structurally high
— The Paren Team

Charging Infrastructure Expansion
Q4 Accelerated Canada’s Public Fast Charging Buildout
Year on year, the number of ports deployed grew by 28%
The Canadian infrastructure grew substantially in 2025, adding 529 stations and 1,925 DCFC ports to the market. At the end of Q4 2025, the Canadian market boasted a record of 8,804 fast charging public ports in operation. The deployment accelerated from Q1 to Q4 with a seasonal slowdown in Q2 before re-accelerating in Q3 and Q4.
In Q4, station growth accelerated, marking the strongest quarter of 2025
The Q4 step-up was disproportionately driven by station additions, +37% QoQ, when ports grew by +14% QoQ. This is an indication of expansion via new site openings rather than just larger sites.
Q4 was the strongest quarter of 2025, closing the year with sustained deployment momentum. While demand and utilization vary regionally, infrastructure buildout continues to move forward—closing the year with sustained deployment velocity.
Unique geographical challenges are driving deployment priorities
New station additions outpaced new port additions on a percentage basis. This pattern reinforces a specific challenge to the Canadian market: a continued focus on improving geographic coverage and baseline access as the network scales. 66% of the ports built out in Q4 were outside of the 5 largest CMAs (Toronto, Montreal, Vancouver, Ottawa-Gatineau, and Calgary).

Ports per Station Moved in Opposite Directions in Q4 2025
Average site size varies significantly
In Q4 2025, average ports per station remained materially different across operator types. Tesla stations averaged 13.1 ports per site, while non-Tesla stations averaged 3.1 ports per site. Although the gap narrowed slightly quarter-over-quarter, the structural difference in site size persists.
Ports per station diverged in Q4
From Q3 to Q4, ports per station declined for Tesla and increased for non-Tesla sites.
Tesla deployed 7 stations in Q4 compared to 15 in Q3
Tesla's average site size declined from 14.9 to 13.1 based on two factors: Tesla energized 15 sites in Q3 vs 7 in Q4. In Q3, 5 sites were larger than 16 ports; in Q4, only one. Nonetheless, Tesla sites remain substantially larger on average than the rest of the market.
For non-Tesla stations, the lower ports per station ratio is multifaceted
The non-Tesla average of just over three ports per site is relatively low compared to the current state of the U.S. market (4.1 in Q4 2025) and Tesla. This reflects the composition of the broader market, which includes a mix of dealership installations, smaller independent locations, and single-site deployments—many of which install only one or two ports.
From 2.9 in Q3 to 3.1 in Q4, the growth of ports per station for non-Tesla sites also is notable. The increase reflects a greater share of sites from operators such as BC Hydro, On The Run, and Mercedes Benz, which typically deploy 4–8 ports per site.

Tesla Led 2025 Additions as Market Share Diversified
The top five operators accounted for 76% of 2025 port additions
Deployment activity remains concentrated among scaled players, but not exclusively. The top five operators accounted for the majority of 2025 additions.
Other operators are gaining market share
Circuit Électrique (275 ports), Flo (266), BCHydro (232), and ChargePoint (182) each captured meaningful shares of annual deployment. Tesla remains the all-time leader with one-third of cumulative ports, but its share of 2025 additions (26.6%) was below its 33.4% historical share—indicating that the broader market expanded at a faster pace during the year.
Beyond the top 10, other networks are lagging behind
The ‘Other Networks’ category captured 8.7% of 2025 additions, below its (13.7%) cumulative share indicating a possible change in the landscape focused on the larger players. This reflects a set of networks (including Shell, Petro-Canada, Ivy and NB Power) that were more active in prior years but slowed their deployments in 2025.

2025 Deployment Concentrated in Canada’s Highest-Utilization Provinces
Top three provinces accounted for 88.7% of new ports
British Columbia (614), Quebec (610), and Ontario (484) accounted for 88.7% of new DC fast-charging ports deployed in Canada in 2025. While smaller provinces such as Nova Scotia (+49.4%) and Manitoba (+27.7%) posted strong growth rates, absolute volumes remained modest, signaling gradual geographic broadening rather than a structural shift in concentration.
Utility-backed networks are structurally shaping Canada’s deployment model— particularly in BC and Quebec
Utility-backed networks continue to anchor deployment in the two largest markets. In British Columbia, BC Hydro accounted for 38% of the province’s 614 new ports in 2025. In Quebec, Circuit Électrique represented 45% of the 610 ports added. This concentration underscores the continued role of regulated, utility-led expansion in scaling infrastructure across provinces.
Growth extended beyond the largest markets
Outside the top three, Alberta added 82 new ports, while Nova Scotia (+49.4%) and Manitoba (+27.7%) posted notable growth rates. Although absolute volumes remain smaller, deployment activity now spans most provinces. Infrastructure expansion must continue strengthening the network to support EV adoption beyond the largest markets.

Q4 Power Mix Shifted Away from Ultra-Fast
Deployment Mix Rebalanced in Q4
Canada’s DC fast charging mix shifted in Q4 2025. After ultra-fast (250+ kW) chargers represented the majority of new ports in Q3, deployment moved toward a more balanced power mix.
The share of 250+ kW ports declined from 54.2% in Q3 to 30.4% in Q4, while 150-249 kW increased from 34.1% to 45.6%.
Mid-power chargers regained share
The increase in 150-249 kW share in Q4 is due to a 50% decrease in new Tesla sites vs Q3 (15 vs 7) and a 59% decrease in new Tesla ports vs Q3 (224 vs 92). Lower-power DCFC (24-149 kW) also rose from 11.7% to 24.0%, reflecting a broader mix of site types.
Non-Tesla activity centered on mid-power
Among non-Tesla operators, 54.7% of Q4 additions fell within the 150-249 kW range, with operators striking a balance between faster charging, coverage, and utility constraints. Ultra-fast share declined versus Q3, while lower-power deployments increased—likely reflecting differences in host mix and grid constraints rather than a uniform strategic shift.

Utilization & Reliability
Utilization Rose Despite 28% Network Expansion
Data coverage note: Paren began tracking utilization across more than 80% of Canada’s DCFC ports in mid Q2 2025. As a result, Q3 marks the first quarter with nationally representative utilization data.
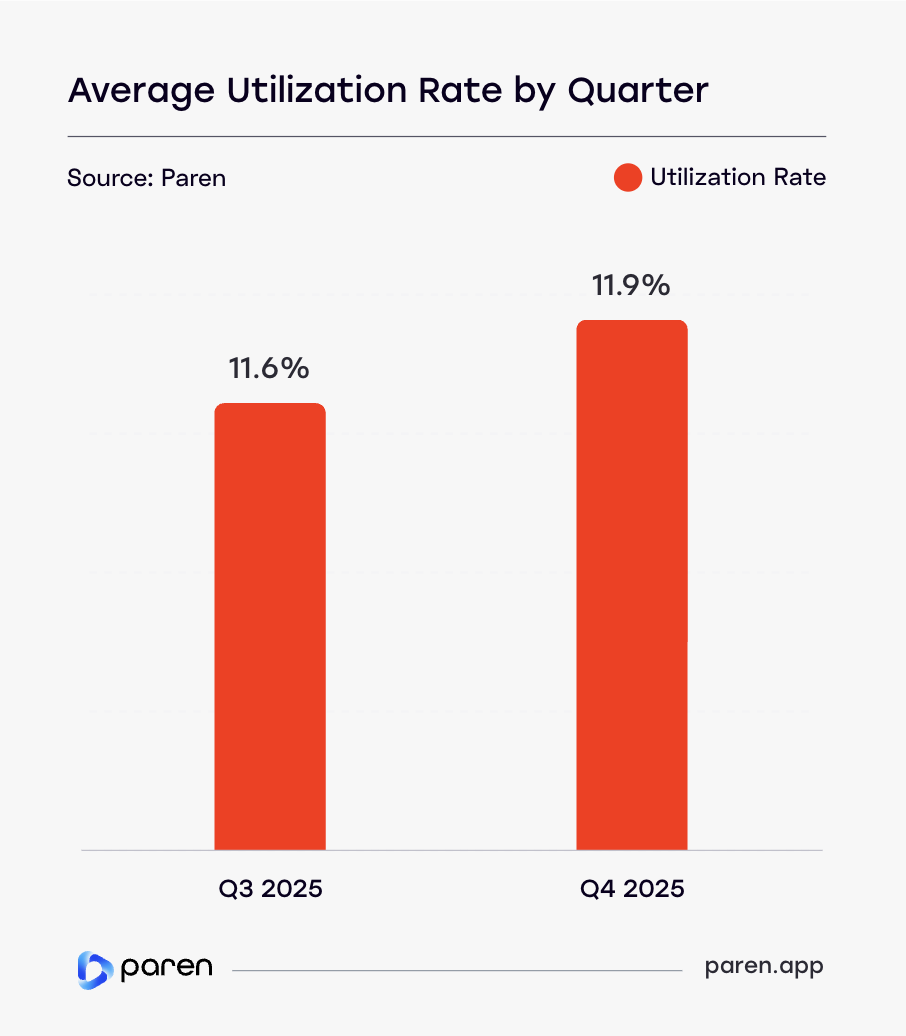
Demand increased despite rapid network growth
Average utilization increased from 11.6% in Q3 to 11.9% in Q4, even as Canada added 642 new DCFC ports in Q4—an 8% quarter-over-quarter increase in network capacity. The increase in utilization despite substantial supply expansion indicates that charging demand is scaling in line with infrastructure growth.
Utilization rose despite slower EV sales
EV sales growth dropped in 2025 following reductions and pauses in federal and provincial purchase incentives. Despite softer vehicle adoption growth, charging activity continued to increase—suggesting deeper engagement among existing EV drivers and increasing structural reliance on public fast charging.
National averages mask local capacity pressure
While the national utilization rate remains moderate, the average masks significant local variation. In high-demand urban corridors and during peak travel hours, utilization levels are materially higher than the national mean—indicating that capacity pressure is concentrated geographically and time-constrained rather than system-wide.
Utilization Rates Vary Significantly by Province
Data coverage note: Utilization is not reported for provinces with fewer than 10 fast-charging stations in operation for which Paren has insights on, to ensure statistical reliability and avoid distortion from small sample sizes.
Utilization concentrated in the provinces driving deployment
In Q4 2025, utilization was highest in British Columbia (14.3%), Ontario (13.8%), and Quebec (11.2%)—the same three provinces that accounted for 87% of 2025 port additions. These high utilization rates will continue to attract future private investments.
Expansion broadening beyond major CMAs
While utilization remains strongest in the largest EV markets, 66% of Q4 deployments occurred outside Canada’s five largest CMAs—signaling continued geographic expansion alongside localized densification needs.
Utilization for several provinces remained in the mid-single digits—including Alberta (6.3%), New Brunswick (5.6%), Nova Scotia (4.9%), and Manitoba (4.7%)—while others were substantially lower, such as Saskatchewan (2.7%) and Yukon (2.6%). This highlights the uneven distribution of fast-charging demand and population density across the country.
Uneven market maturity across provinces
Capacity pressure is concentrated in leading provinces, particularly Ontario and British Columbia, while other regions remain focused on baseline corridor coverage and early-stage network growth.

Fast-Charging Utilization Concentrated in Canada’s Largest Metro Areas
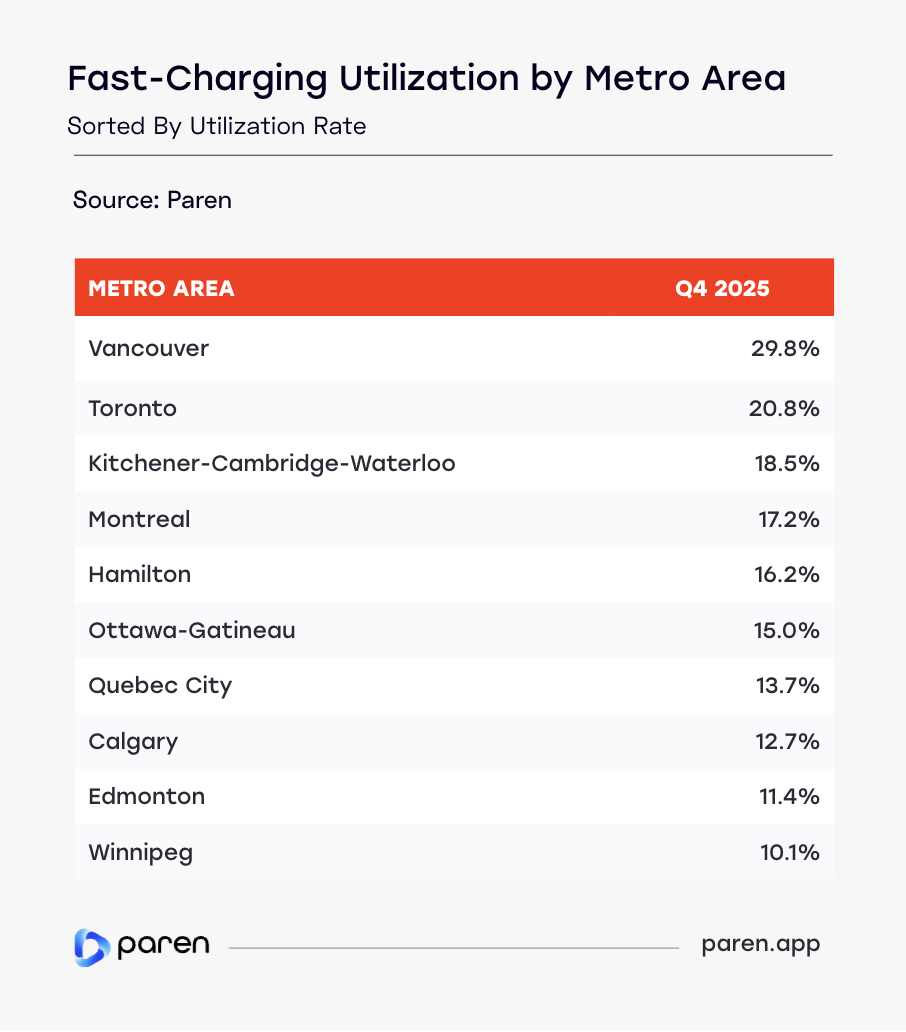
Utilization is concentrated in Canada’s major metros
Fast-charging utilization varies widely across Canadian metro areas, highlighting that demand is not evenly distributed across the country. In Q4 2025, Vancouver recorded the highest utilization among tracked metros at 29.8%, followed by Toronto (20.8%), Kitchener (18.5%), and Montreal (17.2%)—underscoring the role of Canada’s largest population centers in driving charging activity.
A clear gap between top and bottom markets
Beyond the top three, utilization declines meaningfully. Mid-tier metros such as Hamilton (16.2%), Ottawa (15.0%) and Quebec City (13.7%) remain elevated, while several metros fall into low double digits including Calgary (12.9%), Edmonton (11.7%), and Winnipeg (10.1%). This spread indicates substantial regional variation in charging demand and network throughput.
Implications for buildout and capacity planning
These differences suggest that infrastructure needs are likely to be highly localized. Higher-utilization metros may require continued capacity expansion to maintain driver experience, while lower-utilization markets may remain more focused on coverage buildout and early-stage network scaling.
Home charging access drives utilization gaps
Lower utilization in Calgary, Edmonton, and Winnipeg reflects higher single-family housing and lower EV adoption—enabling more home charging. Vancouver’s elevated utilization is partly structural, driven by its high share of multi-unit housing, high level of ride-share drivers and greater reliance on public charging.
Sessions per Port per Day
Sessions per port per day (SPPD) measures how frequently individual fast-charging ports are used and provides a direct indicator of charger-level network load. In Q4 2025, provincial SPPD trends mirrored utilization patterns — reinforcing where demand intensity is strongest.
Higher activity concentrated in core deployment provinces
Ontario (6.1 SPPD) and British Columbia (6.0) recorded the highest charger-level activity, followed by Quebec (4.5). These three provinces accounted for 87% of 2025 port additions, underscoring that new capacity continues to scale in markets with the strongest demand. Together, they represent Canada’s most mature EV markets and a disproportionate share of fast-charging activity.
Lower session intensity reflects coverage-first expansion
Several provinces recorded lower session counts per port—including Alberta (2.7), New Brunswick (2.3), Nova Scotia (2.1), Manitoba (1.7), Saskatchewan (1.1), and Yukon (0.6).
This reflects a network still expanding geographically rather than optimizing for utilization. Notably, 66% of Q4 deployments occurred outside the five largest CMAs, signaling continued investment in corridor coverage alongside urban densification.
Utilization pressure remains localized
While capacity expands nationwide, session intensity shows utilization pressure remains concentrated in Ontario and British Columbia. Many other regions are still building a reliable web of charging infrastructure ahead of sustained demand growth.

Network Reliability Remained Strong in Q4 2025
Data coverage note: Paren’s reliability score incorporates successful charging sessions (with and without retries), failed attempts, and station downtime over a defined period. In Q4 2025, we assessed reliability across more than 80% of all Canadian DCFC sessions, providing a nationally representative view of network performance.
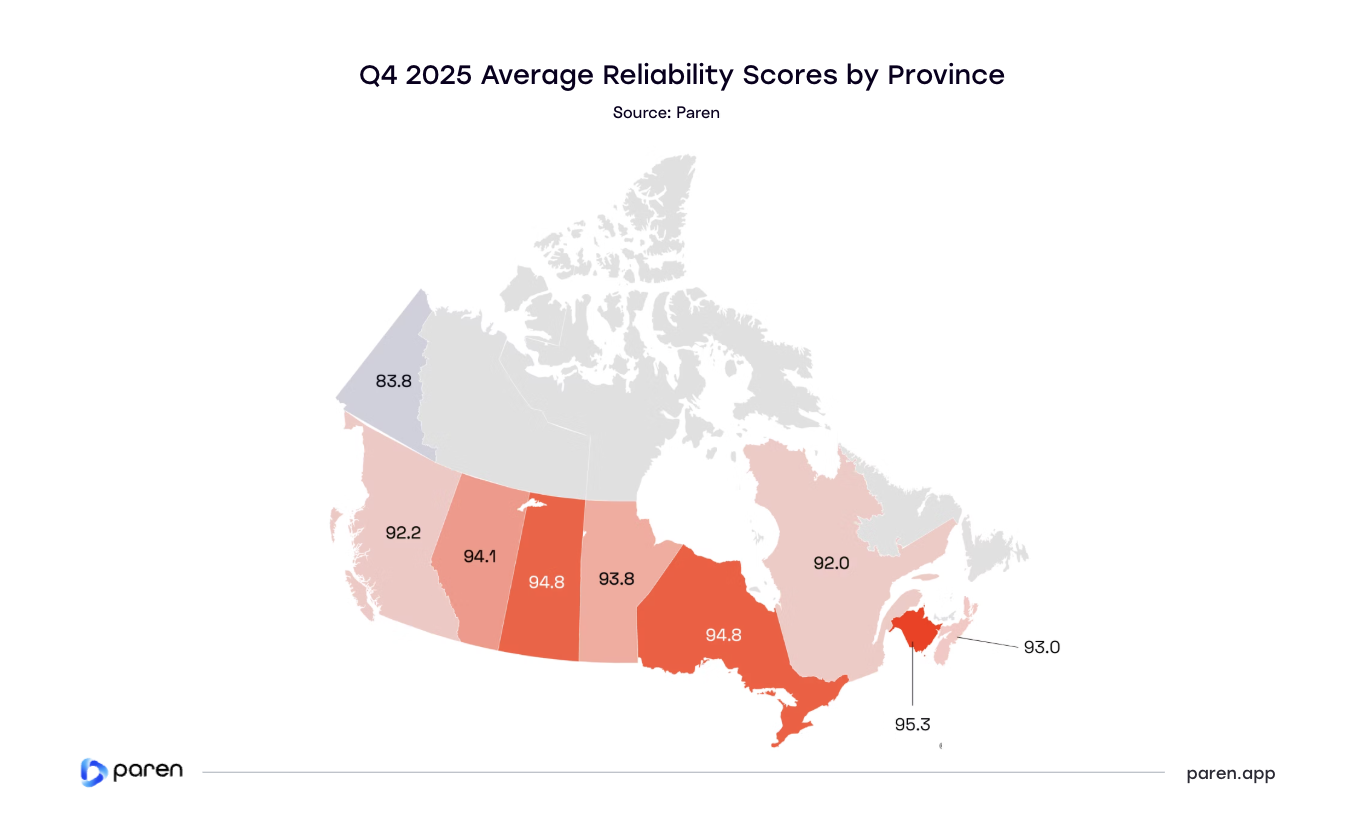
Canada’s DCFC reliability remains structurally high, with most provinces exceeding 90.
In Q4 2025, public fast-charging reliability remained high nationwide, with most provinces above 90. Several stood out for especially strong performance, including New Brunswick (95.3), Ontario (94.8), Saskatchewan (94.8), and Alberta (94.1), indicating broadly stable network operations entering the winter season.
Reliability gaps remain in smaller or remote markets
While reliability was generally strong, Yukon posted lower results at 83.8. This highlights that reliability challenges can be more pronounced in regions with remote infrastructure, smaller networks, and harsher operating conditions.
Implications for driver experience
While reliability remains strong nationally, provinces with the highest charging demand and most widely-deployed networks—including British Columbia and Quebec—show slightly lower reliability than several provinces with moderate demand. This suggests that maintaining reliability becomes more operationally complex as infrastructure utilization intensifies. Sustaining high reliability under rising utilization will be critical as networks densify in core EV markets.
H2 2025: Seasonality & Rising Network Pressure
Sessions-per-port signals tightening capacity
Demand is absorbing new capacity as quickly as it is built. Despite +563 ports in Q3 and +642 in Q4 (+1,205 across H2), SPP in December nearly returned to its July starting point—effectively offsetting the impact of significant capacity additions.
This pattern indicates that new infrastructure was absorbed quickly, with demand growing at least as fast—and likely faster—than supply during peak travel periods. In practical terms: expansion is underway, but network pressure remains elevated, reinforcing the need for continued densification in the highest-demand markets.
Seasonality is visible in both volume and intensity
Fast-charging session volume followed a clear seasonal pattern in H2 2025: a summer peak, an early-fall dip, and a steady ramp around year-end holidays. Total tracked volume exceeded 5.5M sessions over the period, with late summer and December marking the highest demand—consistent with vacation travel and holiday driving.

EV Charging Pricing
Provincial Pricing Models Reflect Distinct Structural Approaches
Data coverage note: Paren’s pricing data summaries start in Q2 2025. This analysis focuses on how price availability shifted from Q2 through Q4 2025.
Canada shows significant diversity in pricing models
In Q4 2025, Canada’s fast-charging market exhibited meaningful variation in how operators structure pricing. Unlike the more standardized U.S. market, Canadian provinces rely on a mix of fixed per-kWh, time-based, and power-based pricing—reflecting differences in regulation, utility ownership, and network strategy.
Pricing strategies differ sharply by province
Adoption of pricing models varies materially across provinces:
- British Columbia leans heavily toward fixed per-kWh pricing (73.1%).
- Alberta, Manitoba, Nova Scotia, and New Brunswick show greater reliance on time-based pricing (75-90%).
- Quebec stands out structurally, with power-based pricing representing 75.7% of stations—largely reflecting Circuit Électrique’s model.
- Ontario maintains a more balanced mix across fixed, time, and limited TOU and power-based pricing.
Model choice helps explain provincial price differences
Differences in average retail pricing across provinces are closely linked to these structural model choices. Markets with higher exposure to time- or power-based pricing tend to exhibit greater pricing variability, while utility-backed and more regulated environments show more standardized approaches.
Overall, Canada’s pricing landscape reflects regional electricity economics and ownership structures rather than a coordinated national pricing shift.

Average Pricing by Province (Q4 2025)
Unlike the U.S. market, where pricing clustered tightly, Canada exhibited a wider provincial spread in Q4 2025. Average prices ranged from the high $0.30s–low $0.40s in British Columbia and Quebec to the high $0.60s in Saskatchewan and Alberta, reflecting structural differences in cost and policy frameworks.
Lower pricing in regulated, utility-backed markets
British Columbia ($0.40) and Quebec ($0.38) reported lower provincial averages in Q4. In British Columbia, LCFS credits help offset operating costs, while in both BC and Quebec, large utility-backed networks operating within regulated structures support moderated pricing. These provinces also have a higher share of 24–50 kW ports in their installed base, which typically carry lower per-kWh rates and help anchor provincial averages. Continued additions in this power range in Q4 further reinforced that pricing dynamic.
Higher prices driven by demand charges and pricing models
Saskatchewan ($0.65), Alberta ($0.65), Nova Scotia ($0.60), and Ontario ($0.58) posted the highest averages—all have a greater reliance on time-based pricing, which is a key contributor to higher retail rates.
Structural cost drivers outweigh short-term demand effects
Despite regional variation, utilization data suggests limited price sensitivity at current demand levels. Pricing differences are driven primarily by electricity rate structures, policy mechanisms, and network ownership models rather than short-term demand shifts.

Appendices
Appendix A
Charging Infrastructure
- CPO: Charge Point Operator.
- Fast Charging: Charging port of a minimum of 24 kW.
- NACS: North American Charging Standard; Tesla’s charging connector now adopted by many networks.
- CMA: Census Metropolitan Area
- Connector: A charging plug conforming to CCS, CHAdeMO, or NACS (J3400) standard.
- Port: A charging unit with one or more connectors capable of charging one or two EVs simultaneously.
- Station: A physical location with one or more EVSEs (charging ports).
Utilization & Reliability
- Reliability Index: The Paren-specific calculation that measures charger reliability taking into account recent successful charge sessions with and without retries, failed charge attempts, and station downtime over a specific time period.
- Tesla: Tesla is a reference to the Tesla Superchargers.
- Utilization: The percentage of tracked time spent on both successful and unsuccessful charging activity at a charger over the time period open per day.
EV Charging Pricing
- Fixed Price: Refers to a consistent rate per kWh for the entire charging day.
- Time of Use (TOU): Pricing changes based on the time of day with higher prices during expected peak demand time. It encourages off-peak charging and can help balance grid demand.
- Dynamic Pricing: Pricing changes based on ad-hoc changes not tied to a specific time. Typically, dynamic pricing daily spreads are within the same minimum and maximum of the TOU model.
- Time: Charges by the minute or hour. Often used where energy-based pricing is restricted.
- Power: Cost is based on the amount of power being drawn by the vehicle with multiple cost-blocks defined based on kW delivery.
Methodology Notes
- All data in this report reflects publicly available DCFC stations.
- Pricing section is based on data from combined sources and is presented at the Station level
- For statistical calculations, Tesla non-member pricing is used.
- Prices are in Canadian dollars and reflect publicly posted standard rates. Member-specific discounts, promotional pricing, and limited-time offers are excluded.
Data Sources
- AFDC+: Paren Infrastructure Dataset
- Proprietary charging session / utilization models
About Paren
Paren is a data platform for EV charging insights
As a neutral platform, Paren uniquely aggregates, enriches and standardizes fast charging across North America. We started these quarterly reports to provide EV charging leaders with a richer perspective on the broader industry dynamics using our unique data and insights.
We value your feedback, email us at: hello@paren.app
Paren provides granular insights on EV charging at scale
Paren is a real-time data platform for electric vehicle charging that standardizes reliability, availability, pricing, and amenities across networks. By covering over 95% of the US fast charging infrastructure, we process over 100M real-time events per day over more than 70K DCFC ports in the US and 7K DCFC ports in Canada. Our partners are automakers, charge point operators, map makers, ride share operators and government entities in need of rich and reliable data.
Offering historical data from January 2024 and real-time data
Our platform offers access to historical and real-time data using the following platforms:
Interested in deeper insights?
- Follow Paren on LinkedIn ↗ link
- Check our blog posts ↗ link
- Read about Paren in the news ↗ link
- Track our monthly CPO/Network leaderboard ↗ link
Report Team


Want the data behind the data?
Access utilization, reliability, and pricing at the station level across 95%+ of US and Canadian DCFC infrastructure.