U.S. vs. Canada: What the Q1 2026 Data Reveals About Two Fast-Charging Markets in Transition

Paren covers more than 95% of U.S. DC fast-charging infrastructure and more than 90% of Canada’s — which puts us in a rare position: we can actually compare the two markets with consistent methodology and real data.
Q1 2026 is the first quarter where we have a full apples-to-apples view of both. Here’s what the numbers show.
Infrastructure: both markets are building bigger, not just more

The strategic shift is identical in both markets: operators are moving away from broad geographic coverage toward concentrated, high-throughput sites.
Utilization: the U.S. is ahead, but Canada is closing the gap

The U.S. market’s higher utilization rate reflects its longer development cycle. Canada’s 11.3% is not a weakness; it’s a reflection of where the market is in its maturity curve.
Pricing: structurally different, for structural reasons
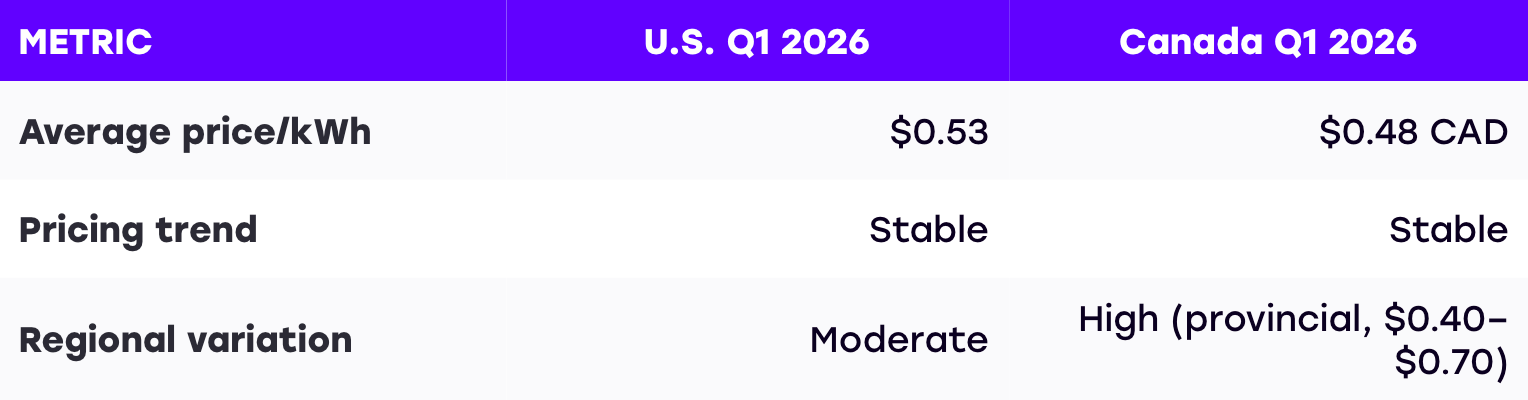
Canadian pricing shows more structural fragmentation than the U.S. — a direct function of provincial electricity markets, differing regulatory environments, and the relative concentration of dominant operators by region.
Reliability: both markets are improving, from different baselines

Reliability in both markets is now primarily a function of operator quality, not geography. The operators investing in monitoring and maintenance are pulling ahead.
The big picture: The U.S. and Canadian fast-charging markets are at different points on the same maturity curve. What both markets share: adding ports is no longer the hard part. Running them well is where the next competitive advantage gets built.
Read the full Q1 2026 U.S. report → Read the full Q1 2026 Canada report →

